
In Personalizing Nutrition - Automating The Science of Metabolomics I defined a therapeutic diet as a diet personalized to an individual’s needs. I mentioned a group called Community Serving, which is a blend of Meals on Wheels and customizing a diet. I also mentioned a service called Habit, which claims to scientifically personalize dietary recommendations by evaluating an individual’s metabolism. Let’s take a look at what they do.
The concept of a metabolic challenge is at least as old as the quest to diagnose and treat diabetes. Diabetes can be defined in various ways, but at its heart, it is an alteration in our 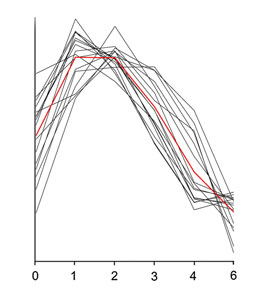 in the way our body processes or metabolizes sugar. A random blood glucose is not helpful in diagnosing diabetes for two reasons.
The first is that our blood glucose varies in response to our intake of sugars so even "fasting sugar", after not eating overnight, is not just a number it is a range of values, as depicted in this graph of glucose concentrations in various individuals over time. The second reason why a snapshot of our glucose metabolism may be unhelpful is because the glucose level may not be elevated enough to be of concern – it may fit within the range of values we consider normal, even if it is not ‘normal’ for that individual.
There is still a vigorous debate within medicine as to what should be the cut-off value separating the healthy blood sugar from the truly abnormal. Yet we have taken to labeling a large part of the population pre-diabetic. The Oral Glucose Tolerance Test (OGTT), was developed in the 1960’s as a response to the difficulties in identifying diabetes simply based on the fasting blood sugar snapshot. The OGTT measures several blood glucose levels 1 to 2 hours after eating a standardized test meal of glucose. Taken together the series of snapshots provides a clearer picture of how glucose is processed by the patient. And again, to be fair, there is still a debate about what is the best screening method for identifying diabetes, but the OGTT “recognizes altered postprandial metabolism,” and as I suggested, that is the real definition of diabetes, it is an alteration in our metabolism.
Another means of identifying diabetes is a later, lagging response to glucose metabolism, glycated hemoglobin or HgA1C. Glucose binds to hemoglobin in red blood cells in proportion to the level of blood glucose. A high blood glucose results in a high HgA1C. And because the linkage is permanent, HgA1C serves us as a type of metabolic memory. It gives the history of blood sugar for an individual. As a generalization, a HgA1C value of between 6 and 7 percent is the point where most physicians become concerned. In general, the OGGT remains the current gold standard, the fasting blood sugar and HgA1C serving as markers, screening for those individuals at or past the threshold of normal. There continues to be one problem for this test; it doesn’t consider what people really eat. Very few of us eat a third of a cup of glucose for breakfast.
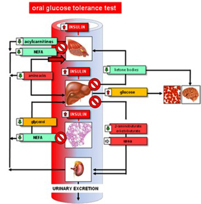 And actual meals, combinations of carbs, fats, and proteins, further complicate the issue of glucose metabolism considered solely by itself. As with many of our discoveries, glucose metabolism is a bit more complicated than simply ingesting sugars, insulin being released from the pancreas and our blood sugars being maintained within a homeostatic range. A range of tissues and metabolites impact blood glucose levels. They include muscle, the liver, the brain, adipose tissue, the kidney and each of these contribute their chemistry, resulting finally in our blood sugar.
So here is the question, and consider it strictly from the viewpoint of describing the process of glucose utilization. Which do you believe is more reflective of the underlying process, a fasting blood sugar or HgA1C or a glucose tolerance test? Each provides a portion of the story; it is the case of the blind men meeting the elephant, each describing the animal by a feature (skin, trunk, leg) but none able to describe the whole elephant.
Back to the Habit approach to personalized nutrition. It is the interactions between our carbohydrate metabolism and our metabolism of fats and proteins that Habit’s ‘metabolic challenge beverage’ seeks to explore. And they make use of the emerging science of metabolomics – “the systematic study of the unique chemical fingerprints that specific cellular processes leave behind," - the study of small-molecule metabolite profiles. Habit’s challenge beverage contains a variety of sugars, fats, and proteins; it is designed to model a typical breakfast. A paper looking at the metabolic response to a similar challenge beverage identified six different time curves of metabolites’ concentrations. [1]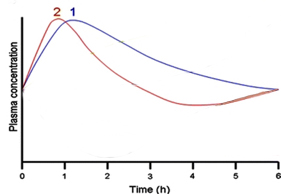
For example, about 30% of the challenge consists of carbohydrates, which cause a temporary increase in glucose (Curve 1) and insulin, as one would expect, with a slightly greater prolongation of insulin’s time course. (Curve 2). Again, from a describing or modeling point of view, it seems to me, that the information we can learn from this test is more robust than a simple OGGT.
We see a greater portion of our true, dare I say holistic, metabolic activity.
The combined interactions, which we summarize as our metabolism, “maintains a well-orchestrated machinery allowing the organism to adapt to the continuously changing environment of which food takes a major share.” These interactions in the metabolism of carbohydrates, fats, and proteins are described as “phenotypic flexibility" . Taken in this way, the OGTT is a “measure of the individual’s flexibility to switch from a catabolic [fasting] to an anabolic [fed] state.” Habit uses a model of phenotypic flexibility in making their nutritional recommendations.
The results of Habit’s recommendations, while based on the science underlying metabolomics, has not been published (although some original papers are anticipated in the next few months). But before consigning their claims to smoke and mirrors, can this level of personalization of dietary recommendations make a difference? The answer to that lies in the last part of our series.
NOTE:
[1] Here is the complete version of the metabolic time curves.
Each curve contains unique metabolites and 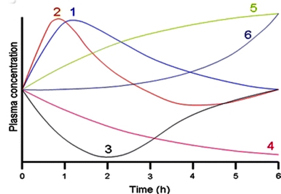 similar patterns of concentration over time.
Metabolites in group 3 decline and recover, group 4 metabolites steadily decline.
Groups 5 and 6 both show increasing concentrations but group 6 changes demonstrate a lag time before concentrations increase.