My colleague, ACSH Senior Nutrition Fellow Dr. Ruth Kava, wrote about a recent study on trans fats and their possible role in reducing heart attacks and stroke. The study made use of a statistical technique called Difference-in-Difference (DID) and it's worth explaining the underlying concept, because it was not a prominent feature of the statistics course I took in school.
Observational studies are different than experiments. what most people think of as science, in that they observe a population over time. Observational studies, often case-control or cohort studies, can be difficult to interpret, in part, because of difficulty in truly identifying the characteristics of the population and finding an appropriate control group.
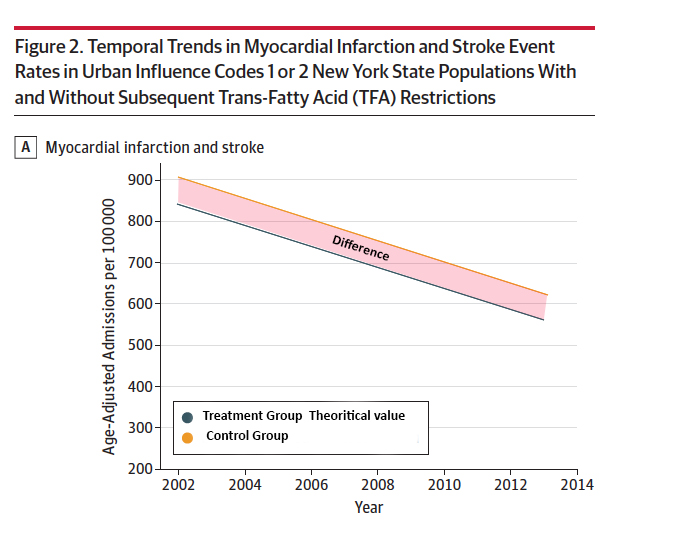
The Difference-in-Difference statistical technique allows observational studies to have the appearance of more traditional research design with a treatment group and a control group. Its important underlying assumption is that even though the treatment and control group are different along a multitude of characteristics, the changes in the characteristic are at similar rates, and when graphed the slopes of the lines would be essentially identical. Because, in reality, we are dealing with different groups that we believe are similar, the starting points will differ.
But we can take the data from the control group and construct a parallel line (same slope, therefore same rate of change) reflecting how the treatment group would respond without any intervention. I have altered the graph from the observational study to demonstrate both the control group and the theoretical changes in the treatment group and the constant difference, in this case in hospital admissions.
We can then add the actual data for the treatment group after it experiences the intervention. The area shaded in blue is the difference in difference that is being measured or calculated.
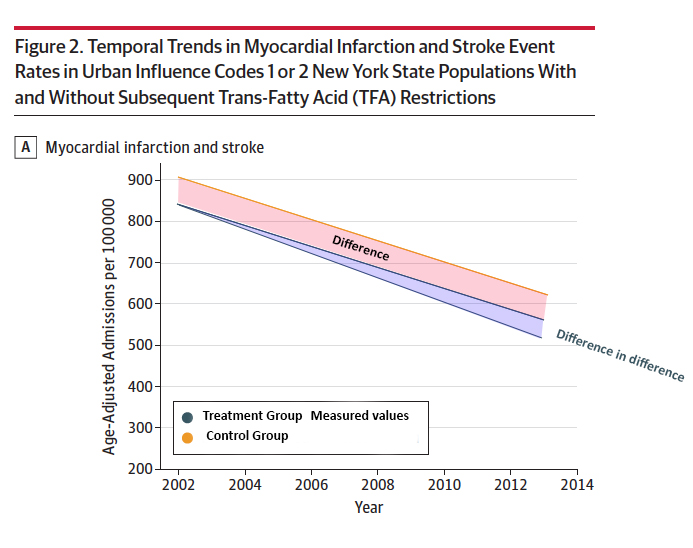
In this study, the treatment was banning of trans fats and the outcome was heart attacks and strokes (as measured by hospital admissions). Given the assumption that despite the myriad of differences in the characteristics of the control and treatment group that they were in essentially the same environment. So any changes in one group would be reflect in the other.
Any additional change in that constant difference is therefore due to the one factor differentiating the groups, the treatment.
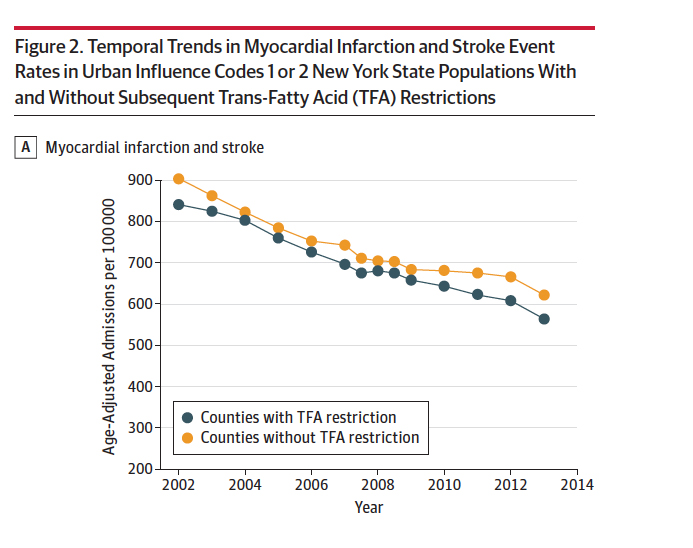
Here is the actual data from the study.
In assessing DID studies it is important to consider the possible differences in the control groups that might impact the analysis. Here is the map of New York and the counties without trans fat restrictions that were used as the DID controls. .

The dark red is being compared to the dark blue based on their classification as urban influenced. The question you must consider is whether you believe one group is similar enough to serve as a control? If the answer is yes, then the DID findings are significant but not in a statistical way.
If you feel the control group is not reflecting the same global environment as the treatment group then you are comparing apples with oranges.
Bottom line, DID can help make observational studies more useful in gaining insight into research questions. But the fact that the information is cloaked as numbers with p values does not eliminate the need for you to consider to what degree the control and treatment groups match up in determining their value.

Chuck Dinerstein, MD, MBA
Director of Medicine
Dr. Charles Dinerstein, M.D., MBA, FACS is Director of Medicine at the American Council on Science and Health. He has over 25 years of experience as a vascular surgeon.