New COVID-19 cases (infections) and deaths began a steep decline in January, followed by fewer deaths a few weeks later, resulting in lower case-fatality rates. Vaccination rates began to increase during this period, but not everywhere nor for everyone. Did these public health benefits result from increased vaccination rates?

Case, Death, and Vaccination Trends
The graph to the right compares regional trends based on 7-day moving averages through June 30. The trends in cases, deaths, and their ratios were roughly parallel. 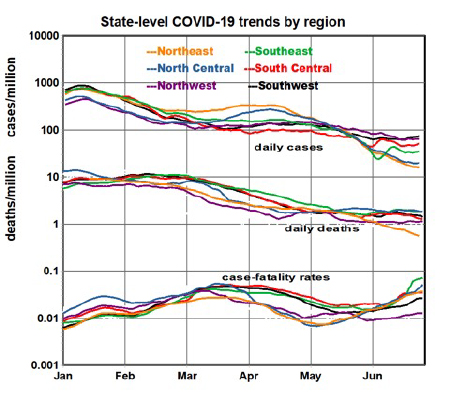
- Regional case rates began to diverge markedly in June, spanning a 4-fold range from Southwest to Northeast.
- Death rates were similar in all regions and essentially flat except for a steady decline in the Northeast.
- Case-fatality rates (CFRs) declined to nearly their lowest rates during the pandemic but increased by about a factor of 4 during June in the Southeast.
We extracted regional vaccination data [2], without differentiation among specific vaccines, focusing on those denoted as “fully vaccinated” (1% corresponds to about 3 million injections per day). Trends in all regions are strikingly 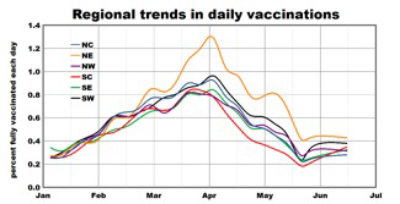 similar, peaking in April followed by steep drops in May and stabilizing in June. The Northeast region stood out from the others beginning in March.
Because COVID-19’s mortality is far more significant in the elderly than young, age is an important consideration with vaccinations. Age-specific data by region are not available, but national data indicate about 80% of those age 80 have been fully vaccinated, but only 33% at age 20.
Herd Immunity - Vaccination Reduces Infections
The Federal government set a goal of 70% complete vaccinations to achieve the public health goal of “herd 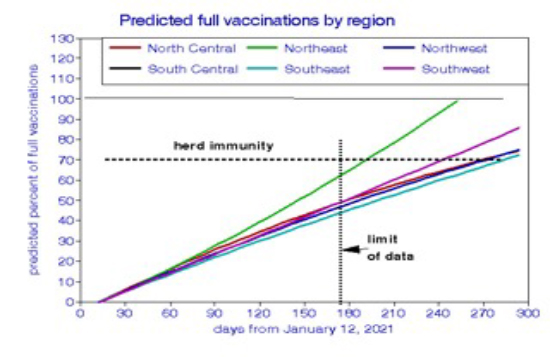 immunity.” We extrapolated curve-fits of the data to assess progress towards this goal, assuming current rates of vaccination. The fit to the original data was excellent, correlating to 99%. The target of 70% will likely be met in July in the Northeast; this will not be the case in other regions nor among all states within each region. International data show that no country has yet to meet this vaccination goal; the US currently ranks 18th among all countries in that effort.
We examined the vaccination-case relationship using two independent analyses, comparing the national 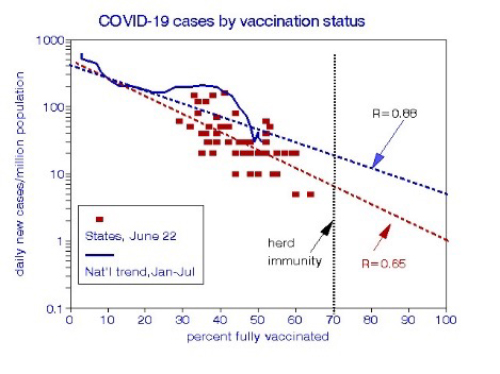 temporal relationships (the blue curved line) and by contrasting relationships among states (the red data points) [2]. The corresponding linear regression lines are significantly associated with the original data and do not differ significantly from each other.
Approaching herd immunity requires successive reductions in new cases; current trends indicate that reaching 70% full vaccinations would reduce daily new cases to 10-20 per million people. For comparison, during the 2018-19 season, there were about 100 new flu cases per million daily. We conclude that the case-loads predicted for 70% complete vaccination could qualify as “immunity.”
The exponential growth of a pandemic occurs when each infected person transmits the disease to several others. We found similar relationships for pandemic abatement since each vaccination removes one potential spreader from the population, thus reversing the pandemic growth process. Unfortunately, US vaccination rates have dropped precipitously since their April peaks and are now too low to achieve national herd immunity any time soon. Achieving the Federal goal would require the other regions to increase vaccination rates by about 50%, similar to those in the Northeast.
[1] https://github.com/nytimes/covid-19-data/blob/master/us-counties.csv
[2] States ranked by percentage of population fully vaccinated: July 12th Becker’s Hospital Review
Coronavirus in the U.S.: Latest Map and Case Count New York Times Accessed July 1, 2021