The World Health Organization (WHO) adopted a dose-response function for PM2.5 that lumps outdoor ambient air quality, second-hand (passive) smoking, and indoor household air pollution. It has been used in 80 published studies of the “Global Burden of Health” (GBD). Here I take a closer look and incorporate some additional risk estimates.

The GBD’s objectives are
“to systematically incorporate information on non-fatal outcomes into the assessment of health status” and “ensure that all estimates and projections were derived on the basis of objective epidemiological and demographic methods, which were not influenced by advocates.” [emphasis added].
This dose-response function (DRF) extends from 1 μg/m3 to 600 μg/m3. It is the basis for the GBD prediction of about 7 million excess global deaths annually - about 25% more than the latest COVID estimate.
PM2.5 is a collection of airborne particles defined solely by size (aerodynamic diameter of less than 2.5 μm). It is measured by collecting and weighing an air sample on a filter. This size cut-off was based on the likelihood of particle deposition within specific regions of the respiratory tract. PM2.5 is relatively easy to measure and can be linked to a wide variety of emission sources; it is basically a regulatory construct.
The Clean Air Act tasks the EPA with regulating emissions from various sources to maintain ambient concentrations within a national standard, i.e., below a threshold for adverse health effects. The chemical composition of regulated pollutants is specified for gases but not for particles, which are not confined to known toxicants.
The scientific issues here include:
- The mathematical function used as the basis for predicting risks (logarithmic vs. linear)
- Previous risk estimates used to support the DRF.
- Differences in the composition of PM2.5 in those estimates.
- Differences in the types of exposures involved.
- Existence of thresholds.
Mathematical Function. I began my assessment by replicating the GBD DRF (the red line) and the data used to derive it. The use of the logarithmic exposure scale is perhaps the most fundamental issue here; it implies that additional exposures multiply rather than add to the mortality risk. This may be the case for infectious diseases in which one victim can infect many others, but it has no role in toxicology, where no-effect thresholds are expected and followed by additive effects. The Clean Air Act is predicated on such thresholds, but EPA has not identified one for PM2.5, nor has the GBD DRF.
The GBD logarithmic function was intended to link three disparate sources of airborne particles
- ambient air pollution [AAP]) from urban traffic, combustion sources, and windblown dust
- second-hand tobacco smoke (SHS)
- indoor household air pollution sources such as cooking and heating (HAP).
A logarithmic DRF underestimates risks at high concentrations and overestimates them at smaller concentrations. The GBD DRF would predict that an order-of-magnitude increase from 10 to 100 or 60 to 600 μg/m3 would double the mortality risk, while a linear DRF would predict no risk at 10 μg/m3 and a risk ratio of about 20 at the higher concentration level.
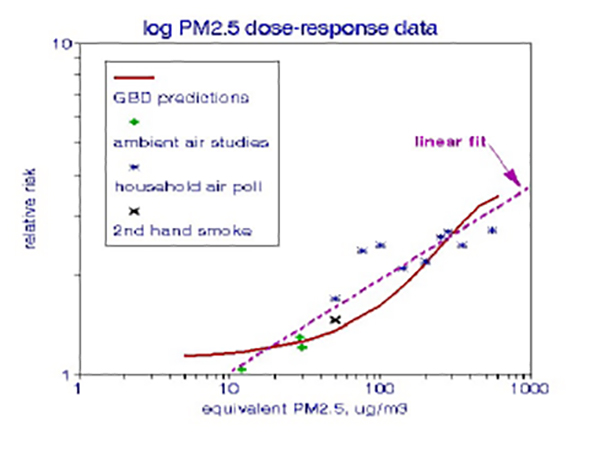
The graph indicates that a linear DRF (the dashed line) could also fit these data, with correlation coefficients > 0.9.
Additional Data. Next, I included additional risk estimates based on London data from the 1960s, primarily to extend the range of ambient exposures. [1] The dataset now indicates two diverging groups of risk estimates, ambient air quality data at much lower risks and household air pollution posing much higher risks. Indoor or household risks may be higher because they involve exposures directly into the breathing zone of individuals. By contrast, the lower ambient data are based on centrally located outdoor measurements for which individual exposures are problematic.
Second-hand smoke (SHS) is a crucial data point in the original GBD DRF, pegged at a PM2.5 level of 50 μg/m3 and well beyond the range of measured indoor levels. I have never seen a long-term indoor PM2.5 level as high as 50 μg/m3, and I changed the estimated SHS exposure to 20 μg/m3 to comport with available measurements. However, the main effect of SHS may be to alter the chemical composition of the indoor air, a factor not considered by the GBD.
PM Characteristics and Exposures. The three types of particles for which the GBD DRF was constructed vary substantially in size, composition, and exposure. The GBD and almost all regulatory assessments make the giant leap of equating either emission rates or ambient concentration levels to actual human exposures, as is the case with the GBD particle categories.
- Homemakers are likely to be directly exposed to indoor pollutants, but for a limited time.
- Lengthy exposures to second-hand smoke may be limited to living with a regular smoker.
- Ambient air pollution poses the most significant exposure uncertainties because it is only measured outdoors. In contrast, we tend to spend ~85% of our time indoors, where air quality can be quite different from that measured at an outdoor centrally-located monitoring station [2].
- Ambient air pollution depends on the emission sources in the area, which vary widely among rural, suburban, industrial, or high-density cities and can be seasonal. The ambient air pollution data that I added are primarily from London in the 1960s, categorized as “British smoke” and measured as the blackness of soot-stained filters rather than the collected mass. Such particles are primarily elemental carbon and are more deleterious than the indiscriminate types of particles collected as PM2.5.
- Indoor pollutants and second-hand smoke are source-specific and presumably independent of geography and time period.
- Indoor air pollution is predominately from indoor use of solid fuels, often under conditions of incomplete combustion (smoldering). Somewhat larger dust particles may also be involved.
- Second-hand smoke includes thousands of pollutants of unknown toxicity, including carbon monoxide, benzene, formaldehyde, and various hydrocarbons. SHS particles tend to be much smaller than 2.5 μm, often called nanoparticles, and are thus capable of entering the bloodstream and translocating to multiple organs.
Thus, there is no physical or chemical similarity among the three categories of particles.
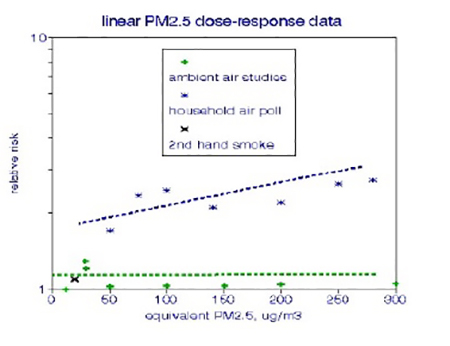
Alternative Dose-Response Functions. I replotted these data with a linear exposure relationship and limited to 300 μg/m3 (an order of magnitude higher than current urban ambient levels); only indoor pollution demonstrates a dose-response relationship, and that relationship is weak.
A valid global risk estimate must be based on all of the available evidence after considering the uncertainties in each such determination. Notably, GBD PM2.5 risk estimates do not include confidence limits.
The GBD DRF fails on all counts:
- The logarithmic function does not comport with toxicological principles.
- Particle composition is not controlled.
- Exposure modality is not controlled.
- Exposure duration is not considered.
- Risks of high exposures are underestimated.
- The validity of the individual risk estimates has not been established.
Further, it is difficult to envision a practical use for such global risk estimates. Excessive exposure to air pollution is already known to portend health risks, as does smoking, but it is far from clear as to which emission sources should be controlled to reduce ambient PM2.5. Perhaps the sub rosa goal of the GBD was to prompt scary media accounts and thus continue the process.
The original admonition still obtains:
Adequate direct evidence to identify the shape of the mortality RR (relative risk) functions at the high ambient concentrations observed in many places in the world is lacking.
[1] Frederick W. Lipfert. Air Pollution and Community Health. Wiley, 1994
[2] Frederick W. Lipfert, Indoor Air Quality. DOI: 10.1080/10962247.2017.1349010