Epidemiological studies have reported statistically significant relationships between long-term air pollution and mortality over the past 50 years, frequently without controlling for smoking. Smoking is perhaps the strongest actionable risk factor in our longevity, and despite dramatic declines, it remains so in modern society. Smoking more than one pack per day can double the risk of all-cause mortality and increase lung cancer risk at least 10-fold.

Smoking
- Constituents of tobacco smoke are carcinogenic.
- Low-smoking populations such as those with religious proscriptions have greater life expectancies.
- The lung is a primary target organ, and autopsies of heavy smokers have shown accumulated deposits.
- Health risks not only depend on whether you smoke but by how much and for how long (the dose)
- Effects have been measured in individuals as well as in various populations.
- Studies have shown the health benefits of quitting smoking
Demonstrations of smoking’s health effects comport with each of these criteria; studies of community air pollution have met none of them.
Studies of long-term air pollution health effects have been based on characteristics at a specific moment within a time frame. My primary focus is to distinguish long-term associations of lung cancer with air pollution from those with smoking after considering race and controlling for income. Here I consider changes in state-level measures of these variables over time.
Data
This is a proof-of-concept study based on convenient and available state-level data sets. I examined relationships between age-adjusted lung cancer incidence and all-cause mortality with smoking data, ambient PM2.5 concentrations, income, and race. [1] Stationary factors like housing conditions, climate, population density, traffic density, and other physical characteristics are assumed to remain essentially invariant over these 10 to 20-year periods and, therefore, not confound the analysis.
During the interval
- Lung cancer decreased 15% from 1999 to 2016.
- All-cause mortality decreased 15% from 2000 to 2019.
- Prevalence of smoking decreased 19% from 2000 to 2014.
- Cigarette sales decreased 28% from 1994 to 2004.
- Mean PM2.5 concentrations dropped 30% from 2003 to 2016.
- Median household income increased three-fold from 1979 to 2014.
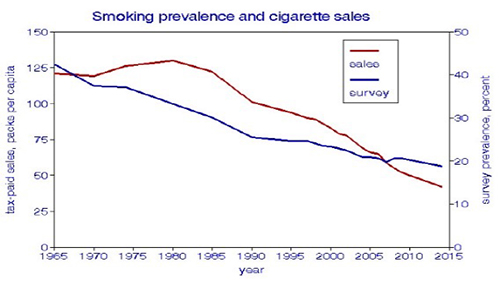 I took into account that lung cancer incidence lags behind the exposure to carcinogens by 1-2 decades. I assumed that the rates of change are approximately linear, as shown in the figure.
Analysis
Statistical analyses were based on changes over time expressed as ratios rather than as actual values.
The two measures of smoking, by survey or sales records, compare well and are highly correlated, but cigarette sales show more detail and account for differences in smoking rates among states and over time. [2]
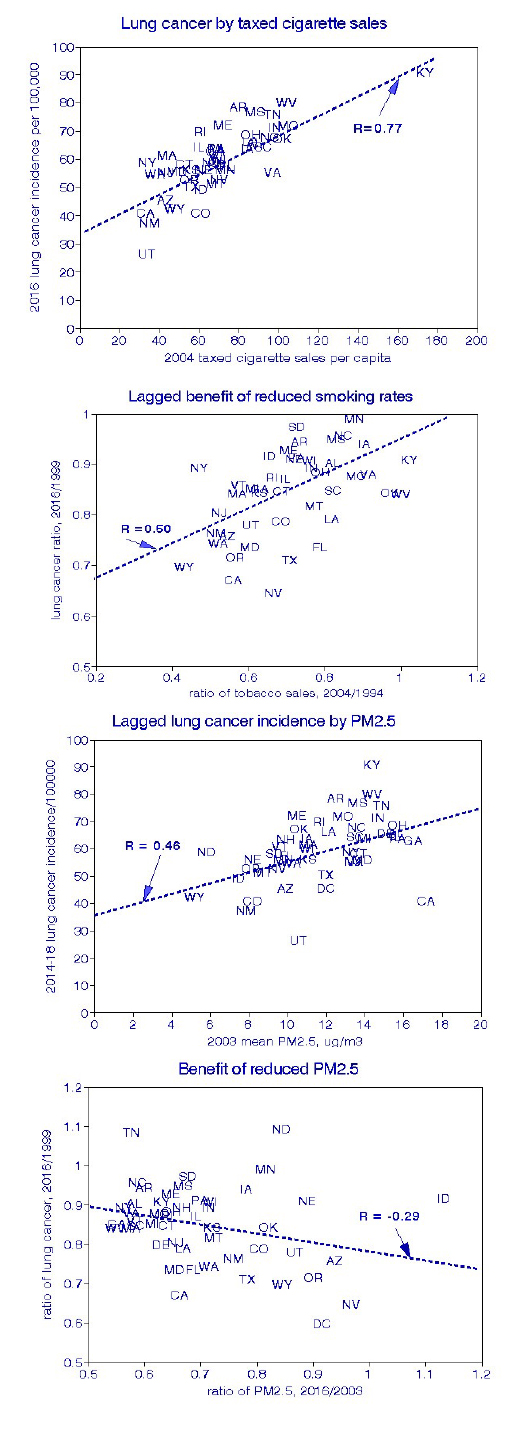 I used linear regressions across states to estimate how much of the changes in mortality could be associated with reducing smoking and improving air quality. These four graphs display the results, comparing lung cancer trends with those for smoking or air quality in terms of the actual rates or changes in those rates. The state-level (population) relationships for smoking are essentially the same as has been shown for individuals.
The lung cancer relationship with actual PM2.5 values is positive, statistically significant, and generally what has been reported elsewhere. However, the relationship between changes in lung cancer incidence among states and changes in PM2.5 is significantly negative. Reduction in PM2.5 did not demonstrate a health benefit, at least for lung cancer.
How can these unexpected findings be interpreted? As an example, Tennessee and Kentucky had high rates of cigarette sales and mortality rates changing modestly over time. New York and New Jersey had lower cigarette sales but nevertheless managed to reduce them further, creating the positive relationship between lung cancer deaths and smoking cessation.
The situation with PM2.5 differs because all four states initially ranked high in lung cancer and PM2.5, which was substantially reduced over time in all of them. Since high lung cancer rates persisted in the high-smoking states, a negative lung-cancer relationship resulted. I found similar results for all-cause mortality, even after considering race and household income.
This leads to the conclusion that quitting smoking is much more critical for lung cancer mortality than cleaning up the air.
Discussion
The scope of the data limited this pilot study. Nevertheless, the analysis avoids confounding and bias problems found in long-term observational studies that limit the interpretation of their findings. Factors unlikely to have changed over the periods involved include:
- Indoor air pollution sources
- Intrastate variations in air quality distributions, including urban vs. rural gradients
- Dietary patterns, including alcohol consumption
- Educational attainment
- Physical fitness
Of course, the nation has not been standing still since 2000. Most respiratory causes of death have diminished, while diabetes and obesity have surged. Other air quality measures have improved while vehicular traffic has increased. Populations have shifted, as have immigration patterns. Residential air conditioning has increased. All these trends provide further differential analyses. The overarching message for risk analysis is:
Estimating the benefits of proposed changes should be based on demonstrated benefits of previous changes.
[1] The following data was used:
- Lung cancer: average age-adjusted incidence from 2014-2018; mortality for 1999.
- Total mortality: age-adjusted rates for all causes for 2019 and 2000.
- Smoking: percent current smokers for 2014; tax-paid cigarette sales per capita for 1984, 1994, 2004.
- Ambient air quality: annual average PM2.5 concentrations for 2016 and 2003.
- Income: median household income for 2014 and 1979.
- Race: statewide percent of African-Americans for 2014, assumed to be constant.
[2] Data on cigarette sales by state and year were obtained from “The Tax Burden on Tobacco,” based on tax receipts. These data do not include tax-free sales, and I noticed some anomalies that reflected excess cross-border sales between states with significant differences in tax rates. For this reason, I excluded New Hampshire, Delaware, and the District of Columbia, leaving 46 states in the statistical analysis.