Disparities in COVID-19 outcomes by race or ethnicity have often been reported, deplored, and attributed to socioeconomic factors. It’s clear that vaccination is the main tool for slowing the spreading of the virus; here we examine disparate vaccination rates by race and ethnicity. However, among such disparities, there is an important distinction between equality (sameness) and equity (fairness).
“The COVID-19 pandemic has exposed social inequities that rival biological inequities in disease exposure and severity.” [1]
In this analysis we used public data sources by state [2] and focused on the distributions of vaccination rates by race (White, Black, Asian) and ethnicity (Hispanic). These detailed data have seldom been reported in conjunction with data on COVID outcomes. First, we examined the distributions of vaccines for those who had received at least one shot and of those who had received 3 shots (“full” plus booster).
We had single-shot data for Whites and Blacks residing in 42 states and the District of Columbia, but in only 38 states for Hispanic and Asian residents. We had data for 25 and 24 states, respectively, for booster shots, which are typically reported as percentages of the fully vaccinated. We multiplied those two rates to obtain percentages of the total population that had (ostensibly) received 3 shots. Mean and (minimum-maximum) values of these percentages as of April 4, 2022, were:
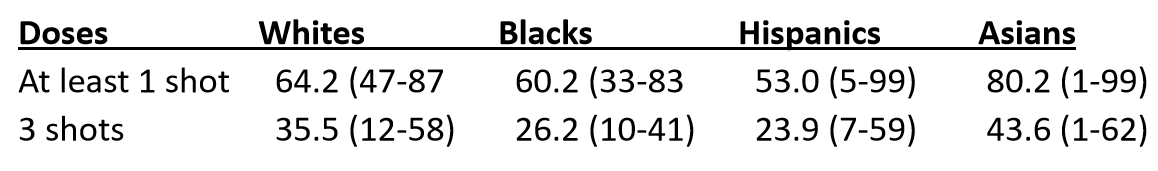
Only about 30% of the population had received 3 shots at this juncture, but the rate for Asians was almost double that of Hispanics. (We viewed the single-digit values with suspicion but had no way to verify them.) The vaccination data for Asians and Hispanics were much more variable than for Blacks and Whites. We analyzed these rates for those who received at least 1 shot or 3 shots in terms of relationships of rates of Black, Hispanic, and Asian residents with those for White residents in a given state. We used scatter plots and linear regressions to characterize those relationships. “R" denotes the linear correlation coefficient in these graphs, a measure of the strength of the relationship.
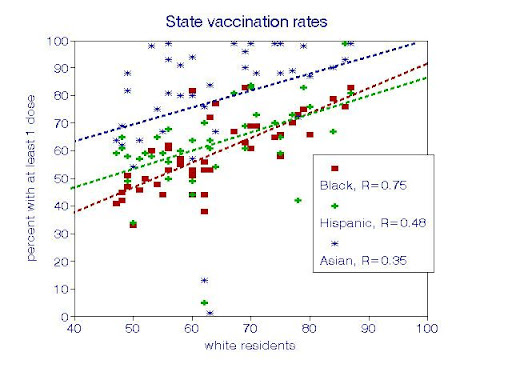
For those who had received at least 1 shot, each relationship with Whites was statistically significant, with a slope not significantly different from unity (1:1 relationship). However, Asians had significantly higher vaccination rates than the others.
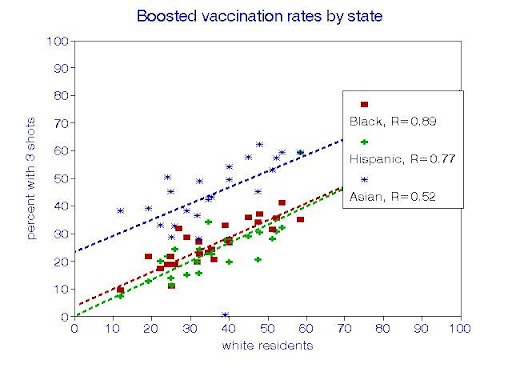
For residents who had also received booster shots, vaccination relationships among the racial-ethnic groups were similar but more precise, with about 6 percentage points in each group for every 10 points for Whites. In addition, the relationship for Asian residents was offset by about 23 percentage points from the others. These parallel lines suggest that the factors relating vaccination rates in one state to those of others are much the same among all 4 racial-ethnic groups.
Next, we considered potential causal factors relating to disparities in vaccination rates among states, in this case as indicated by the percentages of Republican votes in the 2020 Presidential election. Those percentages pertain to an entire state, as opposed to separate racial groups within the state; individual data on voting by race were not available. The District of Columbia is an outlier with a Republican vote of 5% and is not shown.
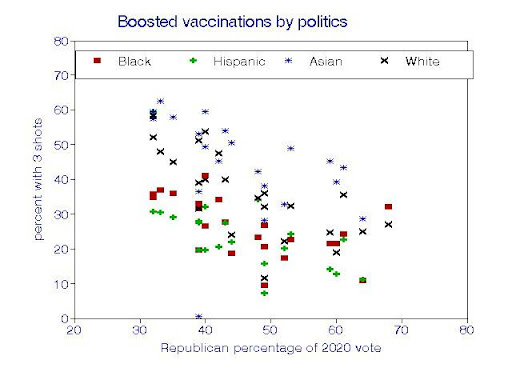
The graph shows vaccination rates decreasing with the percentage of Republican votes in each racial-ethnic group but in different ways; overall trends are clear but the details are less so. The strongest relationship was for Asians, with a reduction of about 8 percentage points in vaccination coverage for every 10-point increase in Republican voting. The relationship for Hispanics was also linear but weaker.
By contrast, the relationships for Black and White residents appear to be nonlinear with upturns in vaccination rates where Republican votes exceeded about 50%. Extrapolating this graph (which is admittedly dicey) suggests that an Asian Democratic voter might have an 80% chance of having had 3 shots, with only about 10% for an Asian Republican. By contrast, a Hispanic Democratic voter might have only a 45% chance. We focused on booster shots because those data appear to be less scattered and represent a better measure of protection against the virus, given the expected waning efficacy of the original (“full”) doses.
To be sure, there are many other COVID-relevant factors that differ by race or ethnicity, especially employment and access to education and health care, for example: [4]
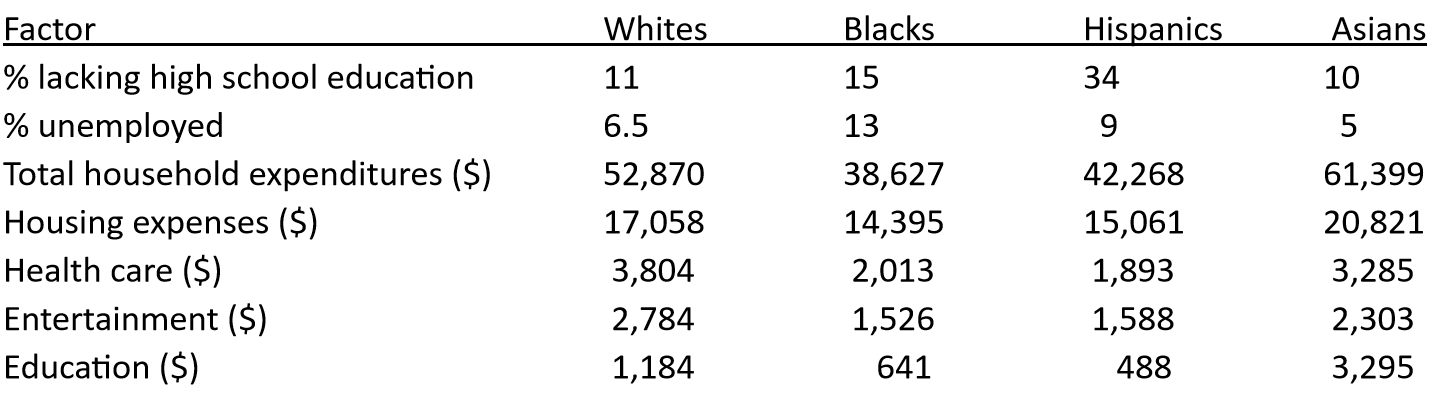
Many of these rankings (Asians high, Hispanics low) comport with the relative booster vaccination rates listed above.
Common perceptions about COVID inequities have focused on socioeconomic disparities that vary by race and ethnicity, some of which affect COVID exposures, testing, vaccination, or access to health care. However, they constitute second-order (i.e., indirect) effects and thus represent inequalities in the population. Continual vaccination is clearly a first-order (i.e., direct) effect on infection. Failure to vaccinate may increase COVID exposures to others, which would be unfair and create inequities.
Vaccination is a personal decision. The ensuing impacts on public health may thus rest more with individuals than with the society as a whole.
[1] Ismail SJ, Tunis MC, Zhao L, Quach C. Navigating inequities: a roadmap out of the pandemic. BMJ Glob Health. 2021 Jan;6(1):e004087. doi: 10.1136/bmjgh-2020-004087.
[3] Khanijahani A, Iezadi S, Gholipour K, Azami-Aghdash S, Naghibi D. A systematic review of racial/ethnic and socioeconomic disparities in COVID-19. Int J Equity Health. 2021 Nov 24;20(1):248. doi: 10.1186/s12939-021-01582-4.
[4] ProQuest, Statistical Abstract of the United States, 2015. Bernan Publishing, 2014.