Some have decided it's over and heralded the end of the pandemic; others say they are not sure. The answer to this recurring question requires a few definitions and statistical regressions.

- Which COVID outcomes are most important? Premature mortality, should we now consider chronic symptoms (“long COVID”), or is the public health destination COVID as an “ordinary” illness”?
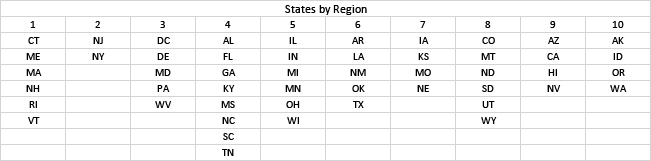
- Who are we? Do we consider the entire US, Federal regions, or states - smaller areas yield less precise estimates.
- Are we there yet? We took a detailed look at recent trends for COVID and influenza.
As usual, there is limited public data. When the CDC declared the COVID-19 emergency to have ended last May, data reporting changed from daily to weekly outcomes, emphasizing hospital admissions and downplaying cases [1]. Detailed data on long COVID are even less available. We considered hospitalizations and deaths in each of the 10 Federal regions [2], including previously unconsidered territories. We selected influenza deaths as the target “ordinary” illness.
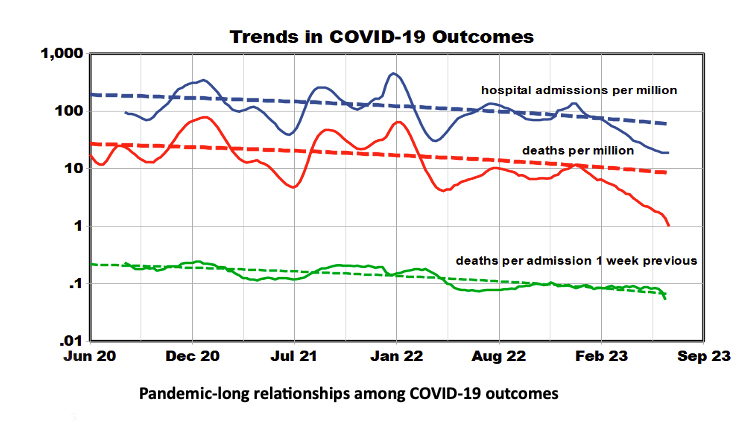
Media typically reports COVID outcomes as numbers of events (counts), showing daily peaks as high as 130,000 hospital admissions and 20,000 deaths and cumulative totals of about 6 and 1.1 million, respectively. Current levels are about 20 times smaller and “lost” amongst the scatter on a linear scale. We consider rates per million population to compare large and small regions plotted logarithmically.
Trends
There is a 50-fold range of deaths during the pandemic, with sharp winter peaks in early 2021 and 2022. In 2023 there was no winter peak, but that sharp decrease merits detailed examination. Median weekly values for hospitalization were 25,000, with 3000 median weekly deaths - about 10-15% of admissions died. Current weekly reported outcomes are about 600 deaths and 13,600 admissions. The downward slopes that began this year starkly contrast with the overall slopes (dashed lines).
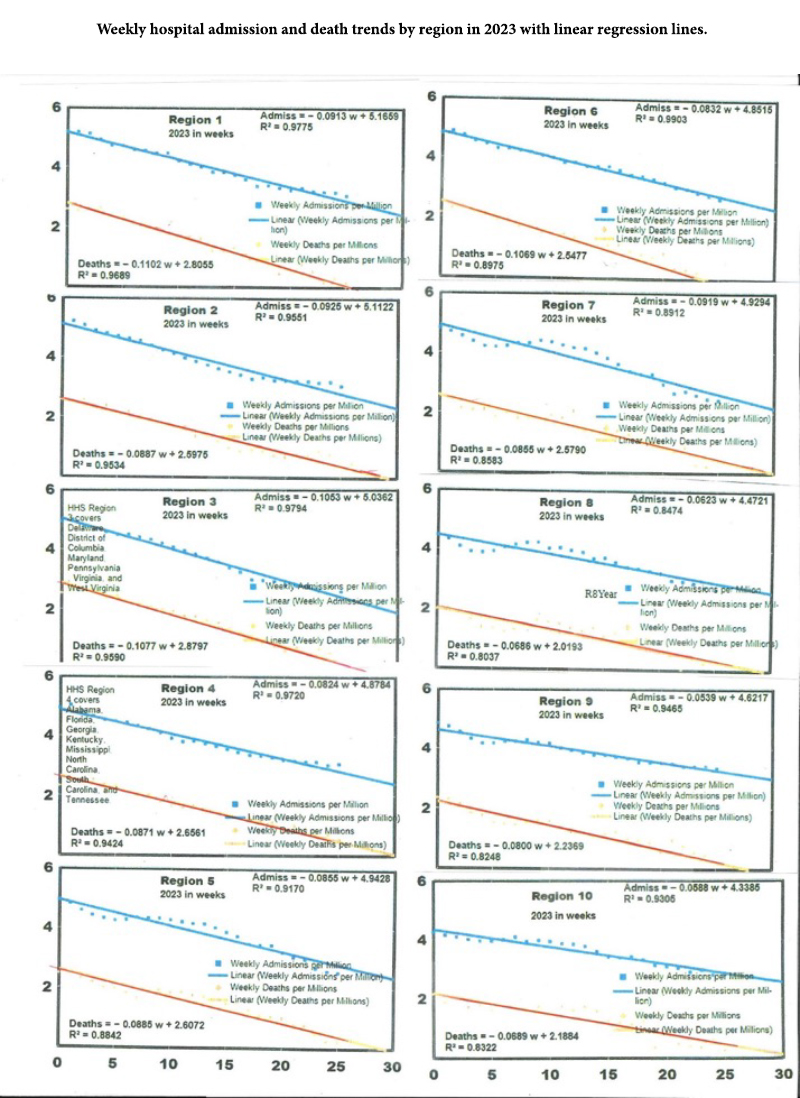
Trends in the hospital fatality rate are one measure of the pandemic’s end. The timeline graphs show that the regional lethality of COVID-19 infections and hospitalization declined sharply during 2021, especially in Regions 1 and 2. Still, regional differences are minimal now, with the lowest values in Region 8. We fit linear regressions of COVID admissions and deaths for each region and state and used the slopes and intercepts to represent the entire 2023 period.
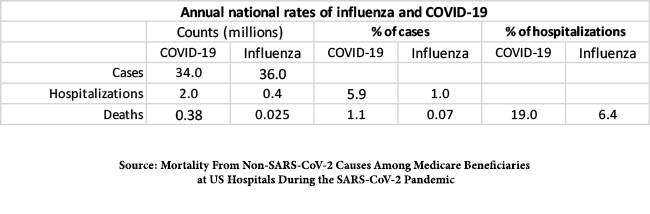
COVID-19 could not be considered ordinary since there were five times as many hospitalizations during the pandemic as in a typical flu season with essentially the same numbers of infections, and the fraction of cases requiring hospitalization was much higher for COVID than for influenza. For comparison, the mortality rate of hospital admissions for all other causes is about 10%. In addition, about 10% of COVID victims develop long-term symptoms (“long COVID”), whereas such sequelae for influenza are rare.
Extrapolation
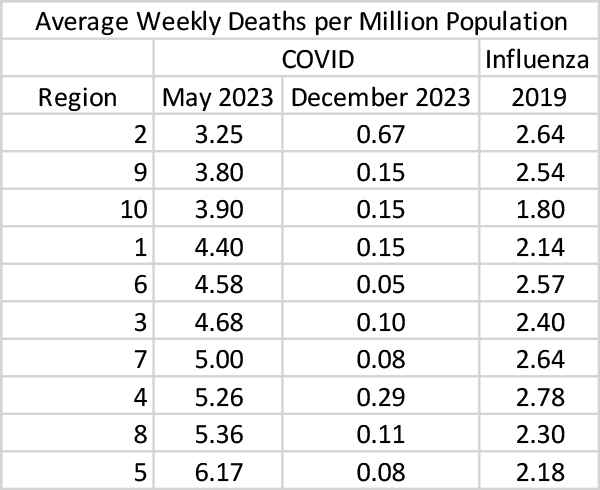
We used the slopes of the May-July relationship in each region to estimate what regional COVID levels might be in December of 2023 and found that each of the regional COVID death rates should drop well below the corresponding 2019 influenza death rate by year’s end.
 If the current steep downward trends continue, COVID rates should drop to well below expected influenza rates, and we could declare victory over COVID-19. However, other factors have not been considered:
- The role and timing of COVID immunizations.
- Any causal relationship between COVID and influenza.
- The continuing importance of long COVID.
[1] Ostensibly because of uncertainties stemming from at-home testing.
[2]