Most COVID-19 concerns have focused on daily infections and their accumulated impacts. Relatively little attention has been given to the lingering symptoms known as “long-haul COVID,” even though it comprises some 30% of cases. The available data are spotty but amenable to the same kinds of population analysis that has been applied to daily cases.

“Current trends indicate that long-haul COVID is our next public health disaster in the making”
What is long-haul COVID?
Symptoms that can persist up to six months after being cleared of the illness:
- Shortness of breath.
- Fatigue.
- Pain.
- Mobility issues.
- Cognitive problems.
Long-haul COVID is more common in women, and the average age of patients is 40. Symptoms may last weeks or months. There are no objective diagnostic tests or biomarkers; pathophysiology is unknown. Conventional evidence linking causes to outcomes is currently lacking. [1]
Data
Statistics on the incidence of long-haul COVID are sparse. I found no data on trends, but I found a listing of statewide estimates as of August 2021. [2] I examined them based on per capita rates (mean = 3.4% ranging from 1.3% to 4.4%) or per cumulative COVID cases (mean = 32%, ranging from 25% to 39%).
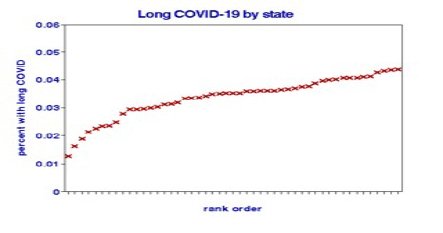
The distributions are tight; lower per-capita ratios are present in Vermont, Maine, Oregon, Washington, New Hampshire, Maryland, and Virginia, in increasing order, and do not include Southern or North Central states.
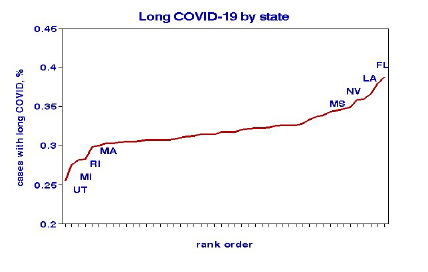 Most of the per-case ratios are also tightly grouped except at either end of the scale, for which some Southern states had higher values. Such outliers could exert undue influence in statistical analysis.
Analysis
I searched for factors that might help explain the variations among the states, comparing the relative performance of these factors. [3] It is clear that more than one factor may be involved. For example, politics can affect vaccination decisions, and poverty status may influence educational opportunities. I investigated two multiplicative combinations: education x income (“socioeconomic index”) and vaccination x Democrat voters (“percentage of vaccinated Democrats”) – a behavioral metric that might be expected to exert negative influences on the incidence of long-haul COVID. One advantage of such a combined measure is displaying the combined effects graphically.
Previous analyses have shown relationships between COVID-19 cases and these factors. As a result, these case ratios may have been partially “adjusted” for them, leading to lower effect estimates for the long-haul ratios. Effects of household crowding, age, and race were either trivial or not statistically significant.
The factors are:
Factor mean value range % effect [3] per case % effect per capita
Persons per household 2.6 2.3-3.2 -3.5 58
Percentage Black 10.6 0.4-37 4.2 5.6
Percentage aged 75-84 43 29-57 1.9 6.5
Education index 51 21-82 -16 -37
Household income $52,100 $38,000 -$72,500 -27 -50
Percent fully vaccinated 45 29-64 -18 -76
Percent Democrat voters 51 30-68 -9.3 -61
Socioeconomic index 274 79-558 -10 -25
Vaccinated Democrat voters 23 10-44 -7.2 -39
Statistically significant effects are shown in bold.
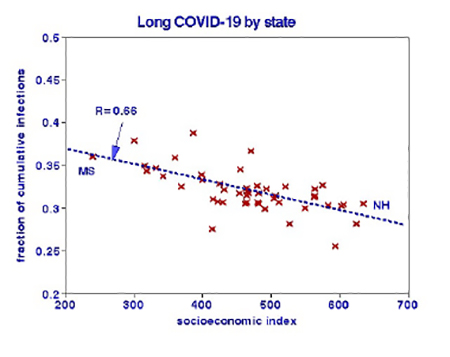
The effects are relatively modest, about 30% over the entire range. Poverty or lack of education (or both) may increase the odds of contracting long-haul COVID-19; causal mechanisms might include comorbidities or failure to seek timely medical care.
Vaccination alone resulted in a slightly better fit with population ratios than the product of vaccinations and Democrat voters. This relationship associates vaccination with a 30-fold reduction of the population incidence ratio of long-haul COVID-19. The efficacy of 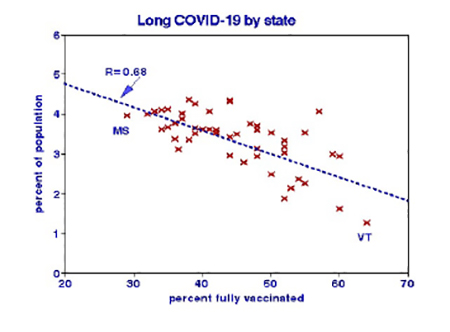 vaccination has been demonstrated in clinical experiments.
Given its appreciable incidence and relatively young age of victims, it would appear that long-haul COVID has been neglected by the epidemiology community. It was mentioned in only 879 of the 208,000 COVID-related papers currently in the NIH database, and I am aware of no previous population-based study. Socioeconomic metrics suggest a need for more detailed consideration of vulnerable subpopulations and additional strong evidence of the importance of vaccinations.
Long-haul COVID-19 deserves much more attention, beginning with public databases and more detailed analyses.
[1] Steven Phillips and Michelle Williams, “Perspective. Confronting Our Next National Health Disaster – Long-Haul Covid. NEJM 2021, 385:577-579. August 12, 2021
[2] Becker's Hospital Review I limited the analysis to the 48 contiguous states.
[3] We used a statistical procedure known as linear regression to estimate these relationships. A linear relationship may be written as y = a+ bx, where b is the slope and a is the intercept, the baseline value. The slope (b) represents the change in y per unit of x. When there is more than one x variable of interest, the equation may be written as y =a+ bx1 +cx2. The regression procedure finds the most likely values of a, b, and c for a given data set, and the correlation coefficient R describes the success of that procedure. The mean effect of x on y is given by b*mean x/mean y; the total impact on y would be given by a + b*mean x1/mean y + c*mean x2/mean y.