The traditional view of air pollution is that of bad stuff in the air produced by someone else, the ubiquitous “them.” Recent concerns about indoor air quality may have broadened that view to realize that some “others” may be us. A recent article in the journal Nature proclaimed, “Local and national governments must ensure that good indoor air quality is delivered….” posing the question, delivered by whom? Amazon pristine?

Clean air is essentially a negative; it results from everyone not polluting.
Most community air pollution results from natural processes of our daily lives instead of the surreptitious dumping of toxins. The founding fathers of EPA identified “criteria” pollutants and established ambient standards to be achieved by reducing the responsible emission rates. These “natural” processes include combustion, transportation, atmospheric chemistry, and activities of daily living, both indoors and out. Here I review the essential task of linking ambient air concentrations with emission sources (apologies to those readers already familiar with these basics).
Chemically Defined Gaseous Pollutants
- Combustion at high temperatures (“complete” combustion) produces oxides of nitrogen (NOx). Subsequent oxidation yields nitrogen dioxide (NO2), the compound for which ambient standards have been promulgated.
- Incomplete combustion produces carbon monoxide (CO), the well-known toxin. So, take your choice; which will it be, NOx or CO?
- Fuel composition is the next consideration. Most of our economy runs on carbon-based fuels, either elemental C (coal) or hydrocarbons (petroleum, wood, CaHb). Inefficient combustion may produce carbonaceous air pollutants.
- Fuel impurities like lead (Pb) and sulfur (S) are being so efficiently removed that their ambient levels are now barely detectable.
- Sulfur dioxide (SO2) from burning sulfur-bearing fuels is increasingly rare in the developed world.
- Ozone (O3) is formed in the upper atmosphere by the action of ultraviolet light (UV) and protects the earth from its harmful effects. In the lower atmosphere, O3 forms through photochemical reactions in the presence of sunlight. It is thus a secondary pollutant with no direct emission sources. In the 19th century, ozone was considered a healthy component of the environment.
Size-Defined Particulate Matter (PM)
PM is the most complex of the criteria pollutants. For regulatory purposes, it is defined by the sampling method rather than a chemical composition. Current methods are based on the sizes of particles to be collected, which govern the regions of the respiratory system in which they may deposit. Filter-based sizing of PM samples has changed substantially during the tenure of the 1970 Clean Air Act.
- The PM was originally based on the blackness of the collection filter and is thus essentially carbon-based soot, familiar from its deposits on outdoor structures and in lungs. Through the years, it has been called smoke, British smoke, smoke-shade, or the coefficient of haze. This is the PM measure used in early epidemiology studies in London, New York City, and Philadelphia, among others.
- Fly ash is the non-combustible residue from burning coal, mostly as silicates. It is captured mechanically from flue gas and disposed of as solid waste.
- In the mid-1950s, the US started a PM sampling program without particle size classification denoted “total suspended particulates” (TSP), ostensibly to check for residual radiation from prior nuclear weapons testing. TSP was used in US epidemiology studies up through the 1990s.
- Size classification followed research studies aimed at smaller acidic particles. Size-selective sampling devices were developed to identify the collected masses of particles with median diameters of 10 μm (PM10) or 2.5 μm (PM2.5), for which ambient standards were then developed. Such PM sampling is now widely distributed throughout the US and worldwide.
- However, aerosol scientists realized that this sampling protocol over-emphasized the largest particles (since mass is proportional to the cube of diameter) and developed methods based on particle counts (numbers per unit volume of air sampled) known as “ultrafines” or nano PM. Articles of nm size are more likely to pass into the bloodstream and thus circulate through the body and be associated with cardiovascular or neurological effects. Unfortunately, this biology-based PM sampling has not proceeded from the laboratory into the field.
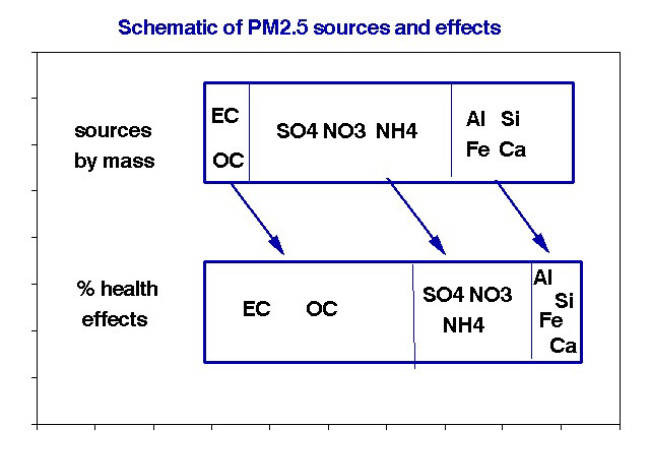
Having been classified only by size, the chemistry and properties of particles collected on any given filter are likely to vary substantially. For convenience, I defined the three subgroups shown in the schematic and rough estimates of their relative health effects. The mean particle sizes increase from left to right, typically 0.3 μm, 1.0 μm, and 2.0 μm. Typical sources include combustion products, reactions with SO2 and NOx, and dust from traffic or construction. The point here is the apparent inverse relationship between abundance and health risk.
Indoor Air Quality
No linear relationships between indoor and outdoor NO2 or PM were reported.
Even though about half of outdoor air pollution is expected to penetrate indoors, the indoor environment is likely to differ. Indoor air quality data are sparse, but we might expect the following:
- Little or no SO2 or O3 because of reactions with or deposition onto interior surfaces and the absence of indoor sources.
- Minimal CO, thanks to wall monitors that alarm dangerous situations.
- NOx from both outside air and indoor sources like gas stoves.
- PM in all size ranges, from ultrafine cigarette and candle smoke to coarser particles from pet dander or household dust and infiltrated outdoor fine particles.
Another indoor source of PM exposure is the “personal cloud,” the air around you. The difference between measurements up close and personal and nearby in the room. It has been interpreted as shedding from skin and clothing and brings to mind the Peanuts character, Pig-Pen. In any event, our personal cloud reinforces the importance of individual behavior on the essential distinction between outdoor community concentrations reported in epidemiologic studies and the actual personal exposures that may affect short and long-term health.
Implications
The differences between indoor and outdoor air quality have often been noted, but the epidemiological implications have not, with long-term mortality, for example.
- Regressions based on outdoor air quality may indicate dying in the presence of pollution but not because of pollution.
- Findings from these outdoor regressions are the only means we have to judge the importance of indoor air quality.
- Indoor air quality is based on individuals' homes and behavior, varying substantially within the catchment area of an outdoor monitor.
- We have no independent information on individual survival as a function of indoor quality.
Sources: Indoor air pollution: five ways to fight the hidden harms. Nature DOI: 10.1038/d41586-023-00287-8