A critically important paper in the journal Frontiers in Pain Medicine concludes that while the rationale for reducing opioid prescriptions to minimize overdose deaths was sound between 2006-2010, during the ensuing decade the opposite was true. Reducing opioid prescriptions during this time dramatically increased deaths and hospitalizations. In other words, what worked 15 years ago is an unmitigated disaster at this time.

Sometimes there is something staring you right in the face. It's so obvious, but you either can't see it or just refuse to. For the better part of a decade, there has been an obvious logical disconnect staring us in the face: while there has been enormous pressure on medical providers and hospitals to curtail their prescribing of opioid analgesics drug overdose deaths have soared during that time.
Yet, lawmakers and lobbying groups refuse to acknowledge that by any measure, the strategy of addressing burgeoning numbers of drug overdose deaths by cutting off the supply of prescription opioid medications has been a dismal failure. But now, a critically important study published in the journal Frontiers in Pain Medicine should make it more difficult for policymakers to unquestionably follow a deeply flawed plan.
Following is a set of facts that both pain patients and those who advocate for them are only too familiar with:
- There is no longer a surplus of prescription opioid pain medications in the United States. If anything, there is a "shortage" because doctors and hospitals face pressure, legal and otherwise, to limit the number of pills they prescribe, regardless of the needs of patients.
- This has had devastating consequences for both users and abusers of these drugs as well as doctors, especially those who practice pain management, as the DEA counts every pill that is prescribed and persecutes physicians who "overprescribe."
- While drugs like oxycodone and hydrocodone were abused with deadly consequences (a positive correlation between prescriptions and deaths) two decades ago this is no longer true.
- Now, heroin, illicit fentanyl and its analogs, and illegal stimulants are the drivers of overdose deaths to the point where prescription opioids now play only a minor part.
- Within the past decade, efforts to further curtail prescriptions have served only to exacerbate overdose fatalities (a negative correlation between prescriptions and deaths) as well as cause unbearable situations for chronic pain patients who have had their medicines forcibly tapered. (Please remind me what country we are living in and how patient rights are (allegedly) of paramount importance).
- Much of this carnage, in my opinion, can be laid at the feet of the Physicians for Responsible Opioid Prescribing (PROP), a shadowy but influential group of self-appointed experts whose members benefit handsomely by becoming highly paid "expert witnesses" representing states that are seeking huge verdicts against manufacturers and distributors of prescription opioids, regardless of whether the company being shaken down has done anything wrong or not.
Although pain patients and advocates have been screaming about these abuses – mostly on deaf ears – for years, they have been largely ignored, But a new study in the journal Frontiers in Pain Medicine demonstrates exactly how wrong-headed our prohibitionist policies have been. The study is long and complex, containing 37 references. I will focus only on the highlights and overall message – that the policy of severe restriction of prescribed opioid drugs may have saved lives 20 years ago, but times have changed.

Aubry and Carr, Front. Pain Res., 04 August 2022
Sec. Pain Research Methods, https://doi.org/10.3389/fpain.2022.884674
A (very) little lesson on statistics
The field of biomedical statistics is complex and difficult. I am nothing close to an expert. But you don't have to be one to understand certain basic concepts. One of these is called linear regression analysis. Sounds awful but it's really pretty simple:

Source: IBM
In other words, does a known dataset (e.g., consumptions of oranges) correlate well with an outcome (e.g., improved eyesight)? Here, the independent variable is orange consumption and the dependent variable is eyesight.
Data of any two variables can be graphed and the resulting line gives you an idea of whether the two trends have much to do with each other. Here's an example:
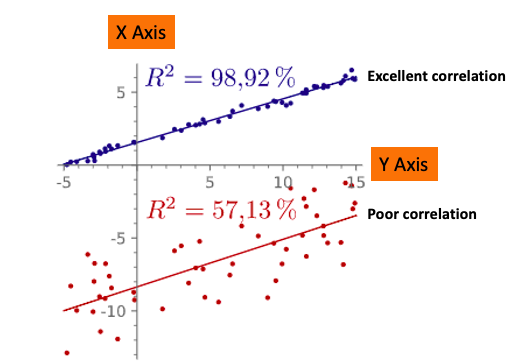
Two graphs, one (blue) with an excellent correlation of the two variables, and one (red) with a poor correlation. The R2 figure (98.9%) tells us that the two variables are highly correlated, which is also seen by how close the data points fit a line. The data points in the red graph fit the line poorly and this is reflected in the lower R2 value of 57.1%. Original image: Wikipedia.
A real-life example for the top graph might be seatbelt usage vs. the number of miles driven per passenger fatality, something that is intuitively obvious. An example of the bottom graph could be seatbelt usage vs. the development of melanoma, two obviously unrelated variables.
Without going into (shudder) the math, the number R2 (R-squared) represents how closely the relationship of the two variables fits a straight line. The closer to 1.00, the better the correlation. When R2 is a positive number there is a positive correlation; when R2 is negative so is the correlation.
Now, let's look at some of the Frontiers in Pain Research paper and see the author's findings (1).
Time period 2006-2010**
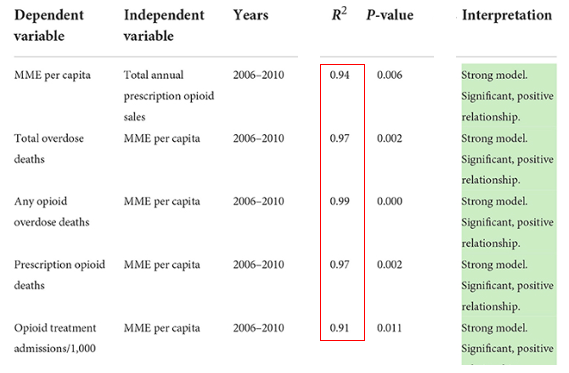
** Chart was edited for clarity and to remove unnecessary data.
The five values indicate that between 2006-2010, There was an excellent correlation (strong model) between:
- Per capita prescribed MME (morphine milligram equivalents) and opioid sales – something that should be obvious. When more opioids are prescribed more will be consumed.
- Total overdose deaths and prescribed per capita MME (from any opioid) and overdose deaths. The more prescription opioid pills available, the more overdose deaths.
- Overdose deaths (from any opioid) and prescribed per capita MME and overdose deaths. The more opioid pills available, the more overdose deaths.
- Overdose deaths (from all opioids) and prescribed per capita MME and overdose deaths.
- The more prescriptions, the more hospital admissions.
So, it is not surprising that Aubry and Carr conclude (4):
For the years covered in the CDC's original chart (for which MME per Capita data are available, i.e., 2006–2010), the CDC's claim of positive/direct relationships between TOD [total opioid deaths], AOD [all opioid deaths], POD [prescription opioid deaths], and OTA [Opioid Treatment Admissions/addiction] and Annual Prescription Opioid Sales (i.e., MME per Capita) were validated (91% < R2 <97%), with statistically significant, positive slopes.
Aubry and Carr, Front. Pain Res., 04 August 2022
Sec. Pain Research Methods, https://doi.org/10.3389/fpain.2022.884674
Translation: During the time period 2006-2010 the more prescription opioids available, the more deaths, overdoses, and hospital admissions.
Then things change - 2010-2019
The year 2010 marked the approval of abuse-resistant OxyContin as well as the beginning of the heroin (and later fentanyl) eras, events that are most certainly related. During this time things have changed, and not by a little. The R2 values are actually going in the opposite direction from the 2006-2010 period.(R2 removes the sign; these values show strong correlation, it is the slope (not shown here) that has changed direction.)
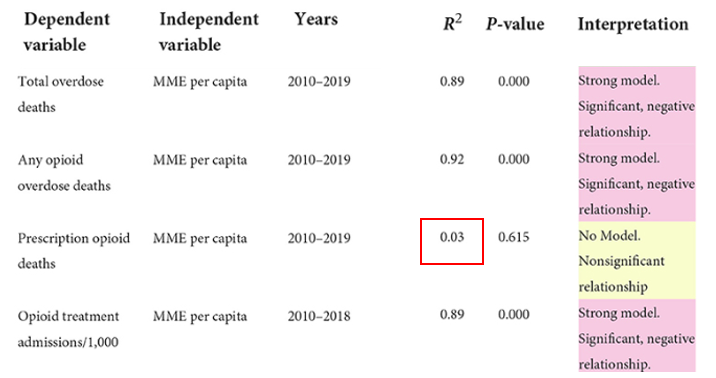
In summarizing, between 2010-2019 there was a strong negative correlation between:
- Prescribed opioids and total overdose deaths. In other words, as prescriptions decreased overdose deaths increased.
- Prescribed opioids and total overdose deaths from any opioid.
- Prescribed opioids and admission to hospitals for treatment. The more prescriptions were decreased, the number of people requiring hospital treatments increased. Why? Illicit fentanyl and heroin, of course.
- There was no correlation (R2 = 0.03) between the number of overdose deaths from prescription drugs. In other words, the amount of prescribed pain medication has nothing to do with overdose deaths from any prescription medication.
Does the sacred 90 MME limit make opioid use safer?
Perhaps where our opioid policies fail worst is the insistence that doctors and patients adhere to the 90 MME or less rule, something I have thoroughly taken apart. Not only is the SCIENTIFIC origin of the 90 MME maximum daily dose mysterious, but there is no evidence that it is anything more than an arbitrary number – a dose that could be too high for one patient and too low for another. One of the given arguments for establishing a maximum daily dose is safety, but the Frontiers in Pain Research paper suggests that this is dead wrong.
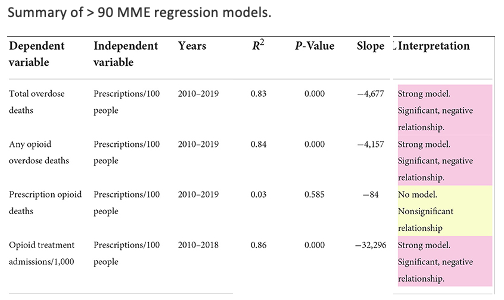
While one might assume that reducing high-dose opioid administration would prevent opioid-related problems, in fact, the opposite is true:
- The number of prescriptions for greater than 90 MME per day had a strong negative correlation with all overdose deaths and hospital admissions.
- There was no correlation between the number of high-dose prescriptions and deaths from all prescription opioids. No, high-dose prescription opioids do not contribute to overdose deaths.
Perhaps someone from PROP or the CDC can explain this to me because it sure looks like prescribing opioids, whether in high, low, or medium doses has no impact on overdose deaths. Could it perhaps be because the pills are a whole lot safer than the heroin and illicit fentanyl that replaced them?
Conclusion
Aubry and Carr don't mince words [emphasis mine]:
"The direct correlations used to justify the CDC guideline and guideline update that existed from 1999 to 2010 are no longer present. Starting in 2010... relationships [between prescribing and overdoses] changed from direct to inverse... These results hold on a national level, in a large majority of states, and even among patients receiving opioid dosages greater than the recommended maximum dosage in the guideline (much less the reduced maximum dosage recommended in the guideline update). Based on the results presented in this paper and the current trends in opioid deaths, the policies of cutting [prescription opioid sales[ to prevent deaths and hospital admissions... are unfounded and ineffective."
Could anyone say this more clearly?
NOTES:
(1) The authors also include limitations of the study in the Description of data sources section.
(2) Of course, correlation cannot prove causation, but in this paper, the correlations are so good that the conclusion is very likely to be accurate.
