
Midterm elections are often tough for the party in power. 1994 and 2010 were disastrous years for Democrats, and some political pundits think the Republicans may be facing a similar punishment in 2018.
A media narrative has formed that many Congressional Republicans are heading for the exits to avoid the coming bloodbath. In fact, CNN has a very detailed article titled, "There Is a Wave of Republicans Leaving Congress." The Republicans, for their part, are painting a "nothing-to-see-here" version of events.
So, which side is right, the media or the Republicans? Statistics can answer the question. (And learning about statistics can show how the media often get the story wrong in science as well.)
There Is No Wave of Republicans Retiring from Congress... Yet
There are 435 members of the House of Representatives. When the 115th Congress began, there were 241 Republicans and 194 Democrats, which means the House is 55.4% Republican.
In CNN's report, they note that 32 Republicans are leaving (for reasons including retirement, resignation, or seeking higher office), while only 16 Democrats are leaving. So far, of those 48 Congressmen who have announced their intention to depart, 66.67% are Republicans.
If the House is 55.4% Republican, but 66.67% of retirements are by Republicans, clearly that shows that a disproportionate number of GOP Congressmen are worried about their jobs and are choosing to leave, right? Statistics say no... not yet, anyway.
There is a statistical test1,2 that can answer the question, "Is this sample proportion (i.e., the percentage of Republican retirements) truly different than the population proportion (i.e., the percentage of Republicans in Congress)?" Surprisingly, the answer is no. The p-value, which gives the probability of getting a proportion that extreme (66.67%), assuming that the proportion should be about 55.4%, is 0.1163. What does that mean?
It means that there's roughly a 12% probability that the proportion of Republicans who chose to retire this year happened by complete chance. In science, we want the probability that our results happened by complete chance to be 5% or less. So, technically, the Republican version of events -- "Sorry, folks, there's nothing to see here" -- is correct. But just barely.
We can examine the test of proportions graphically. (See below.) Given that 48 Congressmen are retiring and 55.4% of Congressmen are Republican, the "expected" number of Republican retirements is 26.6. However, the statistics also show that the range (given 95% confidence)3 could be anywhere from about 19.9 to 33.3. In other words, if fewer than 20 Republicans retired, that would be considered abnormally low; if 34 or more Republicans retired, that would be considered abnormally high.
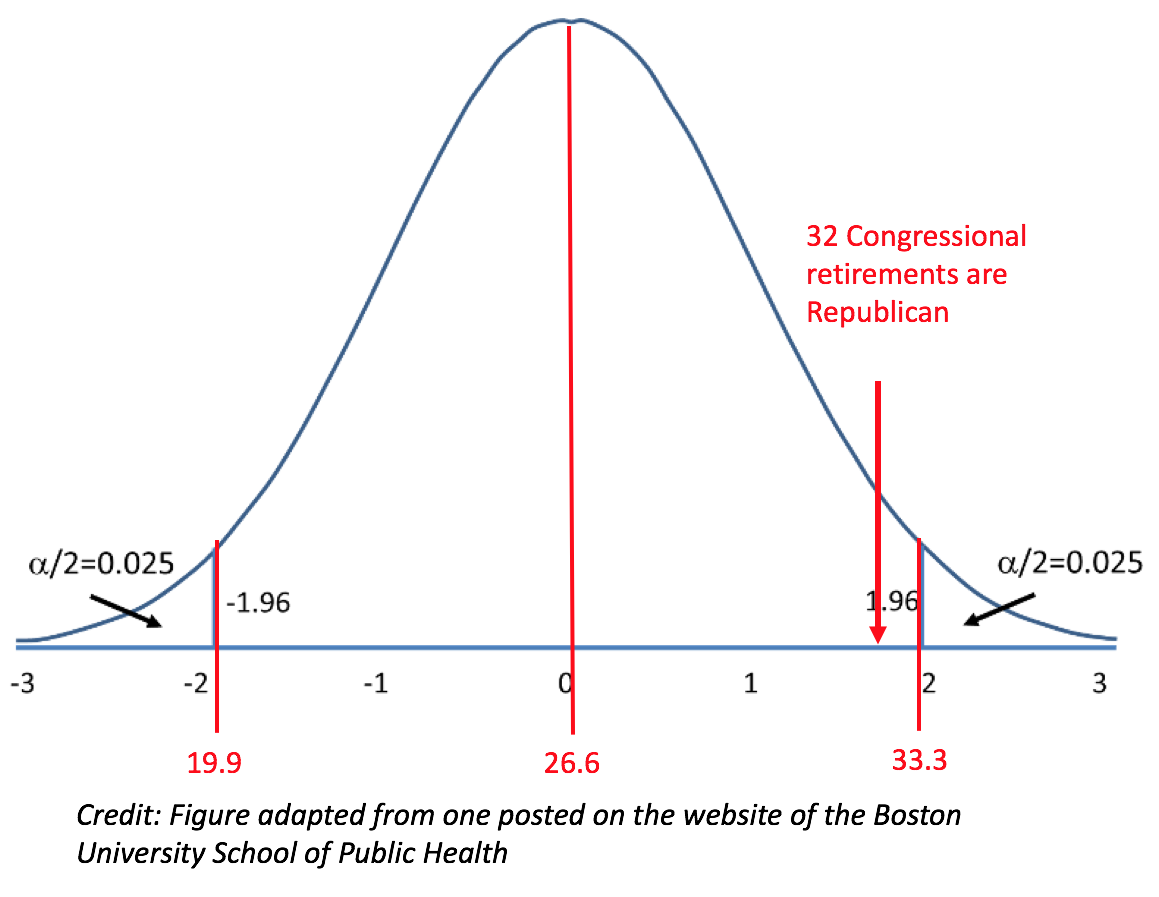
Since only 32 Republicans are retiring -- a number that falls within the range of 19.9 to 33.3 -- we can say that the media narrative about a "wave" of Republicans leaving Congress is wrong. Again, just barely.
Even if there proves to be a mass exodus of Republicans, statistics will have a harder time explaining why. Perhaps some Republicans are older than their Democratic colleagues. Or perhaps some Republicans really are scared of losing. The pundits can fight that one out.
Notes
(1) In this case, we are performing a one-sample, two-sided test of proportions. (Two-sided is probably better since we would not have known necessarily in advance if more or fewer Republicans would plan to retire in 2018.) In R, the code is prop.test(32, 48, 0.554, correct=FALSE).
(2) A biostatistician I consulted suggested that a chi-squared test would be more appropriate than a proportions test. Either way, the statistical conclusions are the same.
(3) The values on the X-axis were calculated using the formula: np0 ± (critical z-value for α = 0.05)*{sqrt[np0(1-p0)]}. That translates to (48)(0.554) ± 1.96*sqrt[(48)(0.554)(0.446)] = 26.6 ± 1.96*(3.44) = 19.9 and 33.3.

Alex Berezow, PhD
Former Vice President of Scientific Communications
Dr. Alex Berezow is a PhD microbiologist, science writer, and public speaker who specializes in the debunking of junk science for the American Council on Science and Health. He is also a member of the USA Today Board of Contributors and a featured speaker for The Insight Bureau. Formerly, he was the founding editor of RealClearScience.


