
A new analysis by 24/7 Wall St., reprinted in part by USA Today, lists all 50 U.S. states in order of "excessive alcohol consumption," which is defined as binge drinking ("four or more drinks in a single occasion for women and five or more for men") or heavy drinking ("at least eight drinks per week for women and 15 for men").
The 24/7 Wall St. article indicates that there is a complicated relationship between income and excessive drinking. Richer people tend to drink heavily, while poorer people tend to binge drink. The conventional wisdom, however, is that poverty is a risk factor for alcoholism. Is it?
Rich Drunk, Poor Drunk
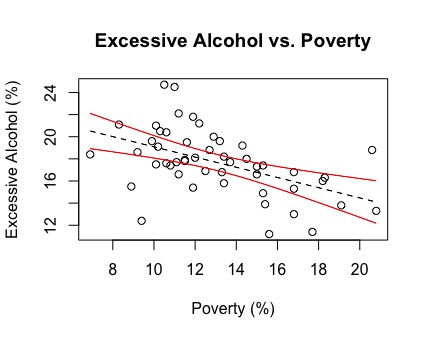 We decided to take a closer look at the data. Each point in the graph to the right represents an individual state. The data are plotted as the percentage of the state's population that drinks excessively versus the percentage of the state's population that lives in poverty1. The best-fit line is in black, and the confidence interval is in red.
Surprisingly, the correlation is negative. That is, as a state's population becomes poorer, people are less likely to drink excessively.
Obviously, that's not what we would expect. What explains this pattern? It is possible that rich people spend their money on booze. However, because this data analysis is ecological, that means there are no data on individuals. So it is quite plausible that, even in rich states, poor people are likelier to drink excessively than rich people. Without data on individuals, it's impossible to definitively conclude one way or the other.
Are People Who Live Further North Likelier to Drink Excessively?
One pattern that has not been explored extensively is the relationship between drinking and geography. Russia and Poland are both infamous for alcoholism. Both countries experience long, cold winters with little to do outside. Could that be a driving factor behind excessive drinking? Our analysis suggests yes.
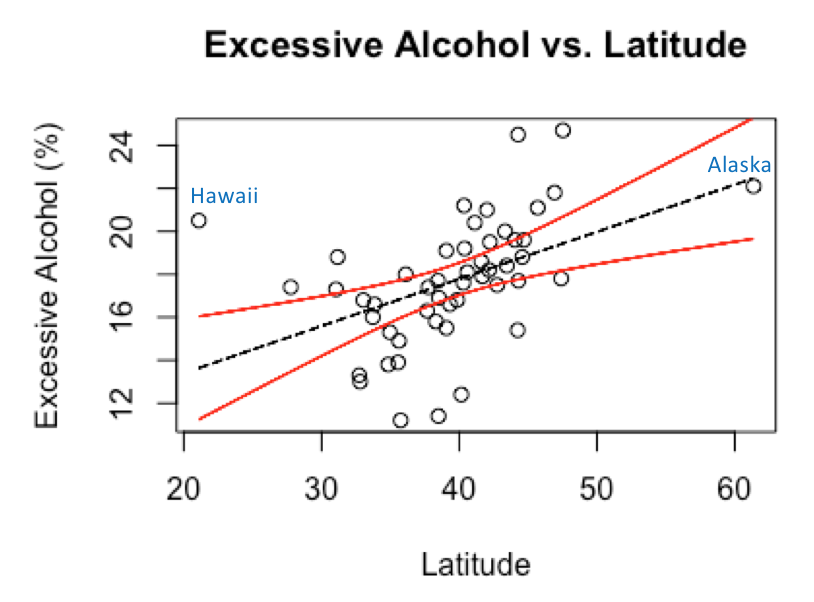 The graph to the right depicts the percentage of an American state's population that drinks excessively versus the state's average latitude2. Once again, the best-fit line is in black, and the confidence interval is in red.
Very interesting. As latitude increases (i.e., a state is further north), the state's population is likelier to drink more.
There are two states in particular worth discussing. Hawaii is a clear outlier. Despite having the lowest latitude of all 50 states, it has an incredibly high percentage of people who drink excessively. (Maybe sitting on the beach all day lends itself to excessive drinking?) The alcohol consumption in Alaska, on the other hand, is about what we would expect given that it has the highest latitude of all 50 states. While it's not an outlier (because it falls almost exactly on the best-fit line), it may be an overly influential point on how the best-fit line is drawn.
So, we removed Hawaii and Alaska and restricted our analysis to the 48 contiguous states.
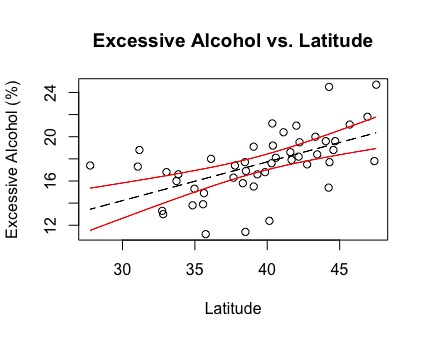
Not only does the relationship hold, it gets a little stronger. (The correlation coefficient r increased from 0.46 to 0.56 after removing Hawaii and Alaska.)
We wanted to answer one last question: Is there still an association between excessive alcohol consumption and latitude after we control for poverty? In other words, if we compare two states that have the same level of poverty and differ only in latitude, should we expect citizens of the state that is further north to have a larger drinking problem? Once again, the answer is yes, though it was no longer as strong3.
Is Geography Destiny?
Much scholarship in recent years has focused on the notion that "geography is destiny." Due to factors such as infectious disease, it may not be a coincidence that richer, more developed nations are located further away from the equator. (Parasites have a harder time surviving in cold weather.)
When it comes to alcohol consumption, however, the reverse trend might be true: The further away one is from the equator, the darker and longer the winter nights -- and, perhaps, the likelier people are to keep themselves entertained with a few bottles of booze4.
Notes
(1) Poverty data was collected from the U.S. Census Bureau and represents a 3-year average poverty rate from 2014 to 2016.
(2) A state's latitude was calculated as the average latitude of all zip codes in the state and was obtained from Ink Plant.
(3) For this analysis, we performed a multiple linear regression on just the 48 contiguous states using both latitude and poverty as predictor variables. When we did the regression on all 50 states, the association between alcohol consumption and latitude remained, but it was no longer statistically significant.
(4) To help confirm this hypothesis, it would be interesting to compare how much alcohol is consumed in the summer (when daylight hours are greatly extended) versus the winter for U.S. states and countries at high latitude.

Alex Berezow, PhD
Former Vice President of Scientific Communications
Dr. Alex Berezow is a PhD microbiologist, science writer, and public speaker who specializes in the debunking of junk science for the American Council on Science and Health. He is also a member of the USA Today Board of Contributors and a featured speaker for The Insight Bureau. Formerly, he was the founding editor of RealClearScience.


