
Perhaps the most important question that each of us wants to know in regard to the coronavirus pandemic is, "Will I get COVID and die?" Being able to answer that question with some specificity should help us craft smart public health policies.
Probably the most useful measure is the infection-fatality rate (IFR), which answers the question, "If I get sick, what is the chance that I will die?" The IFR is calculated by dividing the number of COVID deaths by the number of COVID infections:
IFR = (COVID Deaths / COVID Infections)
This seems straightforward, but it's not. The reason is two-fold: (1) Determining what constitutes a "COVID death" isn't always clear. If a person with high blood pressure gets sick with COVID and dies from a stroke, was it the virus or the underlying health condition that killed him? (2) Determining the number of COVID infections is difficult because of the high prevalence of asymptomatic carriers as well as people who only get mild infections and never bother getting tested.
Despite these challenges, calculating accurate IFRs is important. To generate the best estimates possible, a team of scientists led by Megan O'Driscoll and Henrik Salje collected data on COVID-19 deaths in 45 countries and nearly two dozen seroprevalence studies (which determine the percentage of a population that has antibodies against the coronavirus and, hence, the percentage likely to have been infected). Using this data, they determined sex- and age-specific IFRs. (See chart.)
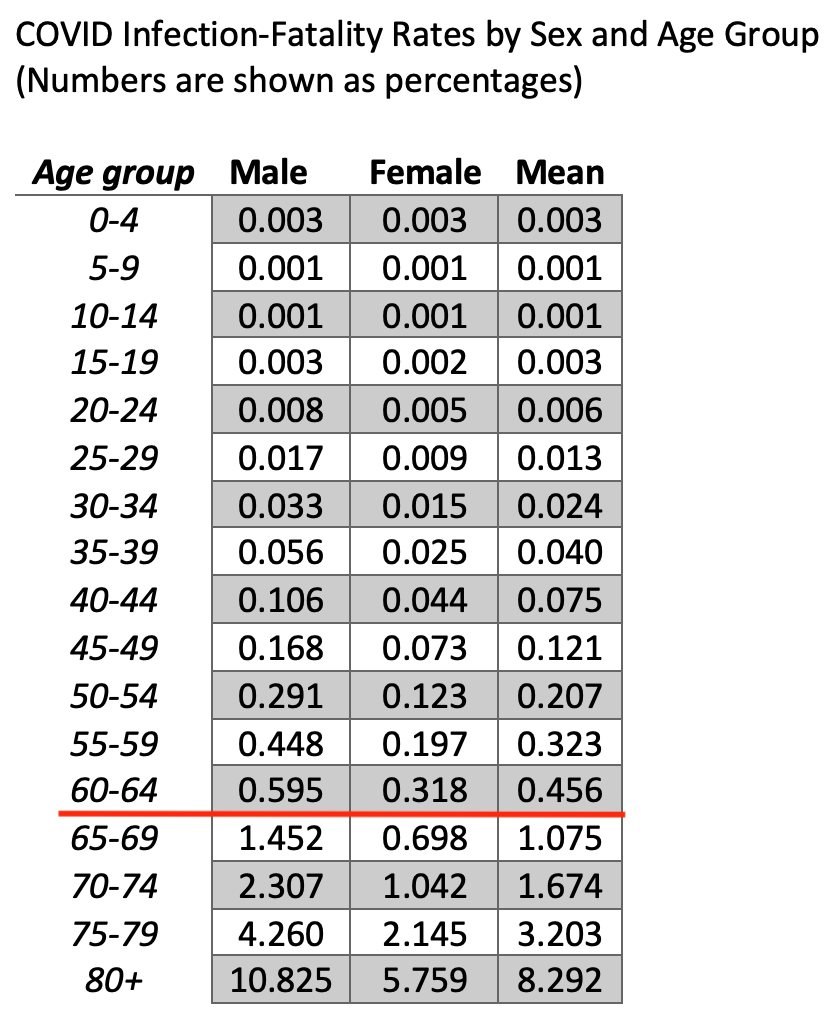
There are several observations worth noting. First, as we have long known, people of college age and younger are very unlikely to die. The 5-9 and 10-14 age groups are the least likely to die. (Note that an IFR of 0.001% means that one person in that age group will die for every 100,000 infected.) The 0-4 and 15-19 age groups are three times likelier to die than the 5-9 and 10-14 age groups, but the risk is still exceedingly small at 0.003% (or 3 deaths for every 100,000 infected).
Second, the IFR slowly increases with age through the 60-64 age group. But after that, beginning with the 65-69 age group, the IFR rises sharply. This group has an overall IFR just over 1% (or 1 death for every 100 infected). That's a fairly major risk of death. (The red line in the chart marks where the "1% threshold" is crossed.) The IFR then grows substantially and becomes quite scary for people in their 70s and older. People in the 75-79 age group have more than a 3% chance of dying if infected with coronavirus, while people aged 80 and over have more than an 8% chance of dying. That's roughly the same chance as rolling a four with two dice.
Third, the virus discriminates. Beginning with the 20-24 age group, men are about twice as likely to die as women from COVID. This pattern remains in each age group through 80+.
With this data, let's hope that public health officials and policymakers can craft smart guidelines in regard to what parts of society should be locked down and how vaccines should be allocated.
Source: O’Driscoll, M. et al. "Age-specific mortality and immunity patterns of SARS-CoV-2." Nature. DOI: 10.1038/s41586-020-2918-0 (2020).

Alex Berezow, PhD
Former Vice President of Scientific Communications
Dr. Alex Berezow is a PhD microbiologist, science writer, and public speaker who specializes in the debunking of junk science for the American Council on Science and Health. He is also a member of the USA Today Board of Contributors and a featured speaker for The Insight Bureau. Formerly, he was the founding editor of RealClearScience.


