Food deserts are communities without a supermarket, found primarily in low-income neighborhoods. We have evidence from a variety of studies that the diet of folks living in these areas is less than nutritious, at least based on USDA criteria. Believing “you are, what you eat”; the evidence chain connecting these two findings suggests that one of the reasons for nutritionally poorer diets in low-income neighborhoods was the lack of supermarkets and their fresh produce. Based upon this evidence the federal government has instituted programs to support supermarkets opening in these underserved areas. But what if the problem is not entirely about supply, what if “build it and they will come” is ineffective? A recent paper from the National Bureau of Economic Research [1] looks at the evidence again and finds that preference (demand) and transportation have roles we had not previously considered.
The author's data comes from actual purchases, sales, prices, entry of supermarkets and movements of households captured by Nielsen, the company that tracks what we buy and do for the purposes of marketing and planning.
- Nielsen Homescan, a representative panel of 60,000 households that record the universal product codes (UPC) labels for all of their purchased consumer goods. It does not measure consumption, because food is consumed outside the home, but provides food-related purchases. The households are predominantly urban, so extrapolation to rural purchases is problematic. Homescan also characterizes a household’s socioeconomics, like place of residence, income, family members, education, employment, and race. It includes self-reports on the importance of staying healthy as well as a test of their nutritional knowledge.
- Nielsen's Retail Measurement Service collects weekly prices and sales volumes for each UPC sold at approximately 42,000 stores at 160 retail chains. The data reflects the available food choices for four food channels or sources; 53% of grocery stores, 32% of mass merchandiser [2] and 55% of drug store sales. It only captures 2% of convenience store information.
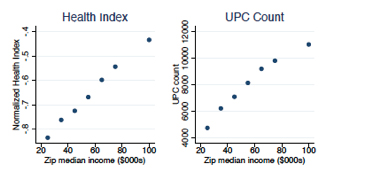
Using the USDA Healthy Eating guidelines, the authors characterized the nutritional value of food (Health Index) based on UPC content; summing the healthy (fruits, vegetables, proteins, and fiber) and subtracting the unhealthy (sugar, saturated fats, sodium, and cholesterol) beyond their recommended daily allowances. All the values were normalized to 1000 calories to allow comparisons. Here is what they found:
- Supermarkets offered the greatest range of healthy food choices. Supermarket size rises with neighborhood income; larger markets have greater, more nutritious UPC choices. Drug and convenience stores had far fewer, less nutritious options.
- The presence of each of the four “food channels” varied by neighborhood. Low-income neighborhoods ($25,000 or less) had fewer supermarkets [3] and more drug and convenience stores per capita than high-income neighborhoods ($70,000 or more).
- 24% of national zip codes lacked a supermarket - were “food deserts,” the percentage rose to 55% when considering only low-income neighborhoods.
 These structural differences in food channels resulted in low-income neighborhoods with less nutritious and fewer UPC choices, 4,200 contrasted with 9,800 UPC choices in high-income neighborhoods. (See accompanying graph)
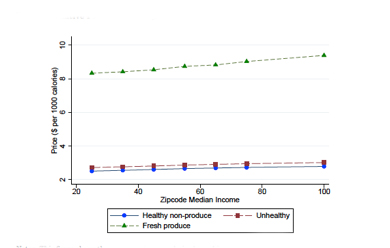
- Fresh produce is the most expensive food purchase. The other food categories show little differences in price between nutritious and less healthy alternatives. High-income neighborhoods pay more for all three categories (13% for produce, 11% for healthy and less healthy other categories) relati
 ve to low-income neighborhoods; paying a slight ‘premium’ for fresh produce. The cost relative to income is less clear. (See graph to left)
- There is a nutrition-income relationship. High-income households buy groceries that are 0.29 standard deviations healthier, than families with income below $25,000. Generally, low-income households purchase more sugar, less whole-grain bread, less produce, and lower-Health Index groceries. [4]
This data of real purchases and supplies are consistent with the literature description of food deserts and ‘confirm’ a supply-side explanation. But does demand change in the face of more supply? Do household choices change when a supermarket enters a food desert, or when households move from a food desert to a zip code with supermarkets?
Entry of a new supermarket closing the food desert
The entrance of a supermarket, according to food desert theory can be summarized as, “if you build it, they will come.” And that is exactly what happened. During the study period, 1,914 supermarkets open in these food deserts. But the health index of food purchases by these households changed very little. The data shows consumers went to the newer, closer supermarkets. But the shift was not from the less nutritious drug and convenience stores in the neighborhood; it was a shift from away from equally nutritious but more distant supermarkets. It was a saving in travel time. Households in food deserts benefit from more variety and reduced travel costs when a new supermarket enters nearby; but because most consumers already travel to shop in supermarkets, supermarket entry does not significantly change choice sets, and thus doesn’t affect healthy purchases.
Place effects
In an attempt to capture unsuspected neighborhood differences, “place-related factors, including peer effects or supply differences other than supermarket density, that could contribute to nutritional inequality;” the authors looked at households relocating. During the study period, thousands of Nielsen’s households moved, there were 17,956 changes in zip code and 10,498 in county of residence. The purchase patterns of these moving households did not change significantly from their old to the new neighborhood; households did not converge toward eating habits based on health index in the new location.
Using this data, the authors modeled food supply and demand, equalizing selection and cost, the two supply-side issues and household UPC choices, the demand side.
- Supply-side changes reduced HI disparity by 9%, mostly from equalizing selection.
- Equalizing what was preferred to that of high-income households reduced the Health Index disparity by 84%
It is a model, and it does have flaws, but it suggests that preference is the larger determinant of the food, not supply. But is there another factor we should consider?
Transportation may be a more significant factor then we have previously considered. The authors alluded to this when they said, in that econ way, “Each week; the household optimizes its calories and nutrients purchased subject to its budget constraint and the opportunity cost of time spent shopping.” They are a little more direct with this statement, “any benefits of “combating food deserts” derive less from healthy eating and more from reducing travel costs.” [Italics added]
The authors point out that only 0.6% of low-income households are without a car – but can this population be ignored. How do you shop in the urban areas where mass transit, not cars, is the primary transportation? Under these conditions, your food purchases, are related to your physical ability to carry food and the means of getting it home.
For many, this means more than one trip to the store a week, after all, a car can hold a lot more groceries than even my Whole Foods wheelie. And if you are making multiple food trips weekly, travel costs become far more significant. Rural areas, largely unrepresented in this study, have transportation issues too. Not only longer distances but less mass transit options. The authors show that a new supermarket reduces travel expenditures, but I think they simplify too much.
Maybe the transportation abilities of the Fresh Directs and Pea Pods of the world can reduce food inequality more effectively than brick and mortar stores. Maybe finding a means of helping the brick and mortar convenience stores of low-income neighborhoods offer more nutritious selections will improve the situation without a transportation solution. We do not know. Perhaps policy should foster experiments to reduce transportation costs, Uber for grocery shopping? Or to improve the options at neighborhood bodegas? Policy should change as our understanding of the evidence changes. This paper opens the possibility that "build it and they will come" is insufficient in reducing nutritional disparities.
[1] These papers are not peer reviewed but represent serious economic thinking.
[2] Mass merchandisers would include the Targets and Walmarts along with club stores like Costco or BJ’s.
[3] Supermarkets are defined as involving supermarkets as well as mass merchandisers, see note 2
[4] High-income households purchased 1 gm more of fiber and 3.5 gms less sugar per 1000 calories; studies within the health literature would characterize these dietary differences to result in a 9.4% decrease in type 2 diabetes and a 10% decrease in death from cardiovascular disease.
SaveSave


