Bill Hammond writing on New York's hospital readmission in Empire Center noted: “modestly improved grades for reducing avoidable admissions” based on the newest release from Medicare. He went on to point out that
- 90% face new penalties [1], down from 93%
- Average penalty 0.85% down from 0.92%
- Much of the improvement was due to a new process comparing hospitals with similar socioeconomic demographics of their patients, rather than an average for all hospitals. A change involving about 36% of all of New York’s hospitals.
The implication was that we continue to do poorly on readmissions and that only a change in metrics improved our performance, and then marginally. But if we look at not only the penalties but at the change in performance, the picture is far less gloomy.
Readmissions
Readmissions are costly, often doubling the cost of care for one of these episodes and that is why it is a key performance indicator. But readmissions have multiple causes including,
- Discharge too early before the patient is adequately stable.
- Discharge to a location, e.g., home, visiting nurse, skilled nursing facility or nursing home that cannot support recovery.
- Recurrence or worsening of the original disease because of poor patient compliance, inadequate supervision or follow-up, or just bad luck.
Although the hospital and its staff to can only control some aspects of these conditions, the hospital is held accountable. Because they only directly control some of the factors and have to coordinate the rest of the care with other institutions or individuals it is hard to improve quickly. That is why I think looking at the rate of improvement is a better metric for consumers and payers to consider than just the absolute penalties.
Changing performance
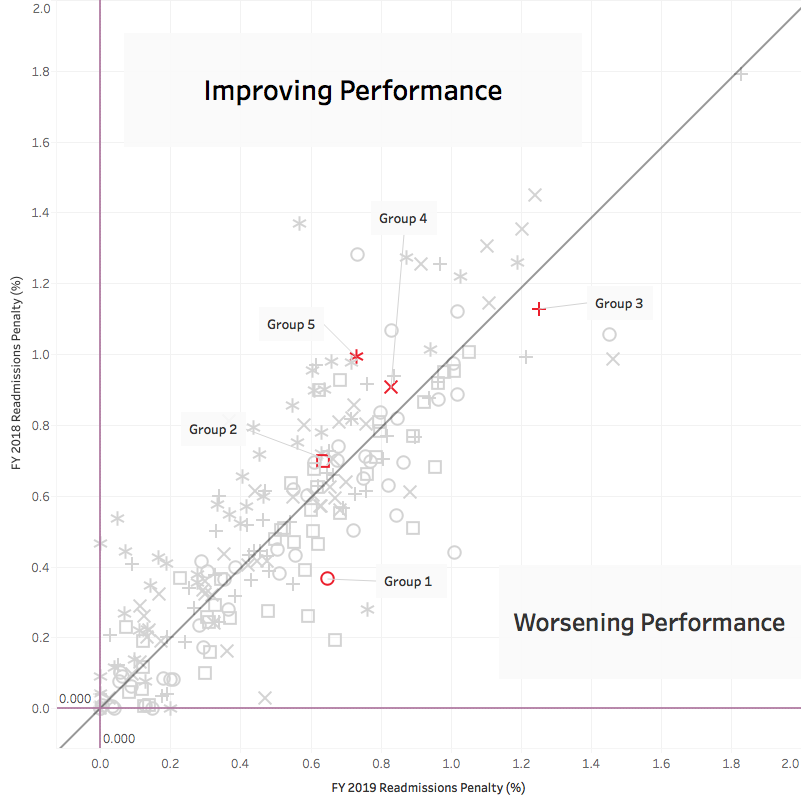
Here are all the states and all their socioeconomic groups. Those in red are the New York hospitals. Group 5 are hospitals with a large percentage of Medicaid patients, patients who have challenges for paying for care, transportation, and language. The ideal spot is in the lower left-hand corner, no penalties at all. Performance is improving for groups above the reference line, especially as you move away from the line to the left. Groups 2, 4, and five account for 115, almost 80% of New York’s hospitals and they are all improving. And those improvements were in nearly every county in New York. Only 17% of hospitals, groups 1 and 3, were getting worse (3% were unchanged). Group 3 when compared solely with their peers demonstrated better than average improvement leaving only the highest socioeconomic group (Group 1) with a greater penalty compare to their peers. [2]
Could we improve more quickly? Yes. But “bending” the cost curve, by lowering readmissions is more easily said than accomplished.
Does it matter?
Perhaps that is the question we should have started with because as it turns out, the benefits of reducing readmissions to the patient and the system are a bit unclear. One study [3] shows declining heart failure readmissions, but more deaths 30 days and one year after discharge. The 30-day increase in mortality would represent a big clinical problem for the readmissions program. Another study [4], states that readmissions are declining and the increasing 30-day and 1-year mortality for heart failure and pneumonia were present even before the program was initiated and that the program had no effect. And more importantly, the latter study also showed increased mortality in heart failure and acute myocardial infarctions during hospitalization – so maybe the patients surviving hospitalization were less ill accounting for a lower readmission rate, rather than any changes produced by the readmissions penalty program.
The truth of the matter is that after eight years of this program, requiring significant effort by clinicians, hospitals and their staff, with penalties but no rewards, we do not know whether there are any beneficial effects for patients. We do know that the penalties offset readmission costs so the “system” benefits, but even the size of that benefit is unknown. Let me end with someone I rarely quote, Dr. Ashish Jha of Harvard’s Global Health Institute,
“All of us as clinicians need to know that if policy makers are going to ask us to change how we practice medicine, it is helping us deliver better care to our patients.”
[1] Hospital’s readmission rate for six conditions (acute myocardial infarction, heart failure and pneumonia, coronary artery bypass, chronic obstructive pulmonary disease, and hip and knee replacements) are compared to an average readmission rate. Those hospitals with higher readmissions are penalized up to 3% of their Medicare payments in the ensuing year. There is no reward for lower readmission rates, only a stick for poorer performance.
[2] There were only four hospitals in this group, two remained unchanged with no penalties, two got worse and were penalized. So this finding may represent a small sample size or regression to the mean over time rather than a change in outcomes.
[3] Association of the Hospital Readmissions Reduction Program Implementation with Readmissions and Mortality Outcomes in Heart Failure JAMA Cardiology DOI: 10.1001/jamacardio.2017.4265
[4] Association of the Hospital Readmissions Reduction Program With Mortality During and After Hospitalization for Acute Myocardial Infarction, Heart Failure, and Pneumonia JAMA Network Open DOI: 10.1001/jamanetworkopen.2018.2777
Data Source: Medicare Eases Readmission Penalties Against Safety-Net Hospitals Kaiser Health News

Chuck Dinerstein, MD, MBA
Director of Medicine
Dr. Charles Dinerstein, M.D., MBA, FACS is Director of Medicine at the American Council on Science and Health. He has over 25 years of experience as a vascular surgeon.


_2007-03-03.jpg)