
For patients undergoing aortic valve surgery and looking for the “right” hospital these are more than academic questions. In fact, which hospital is best depends a lot of how long a survival you are looking for. A new study looks at surgical mortality as a quality metric in choosing a hospital. Turns out, that hospital rankings change with the length of survival.
In the last few years, transcatheter aortic valve replacement (TAVR), a minimally, well really moderately, invasive procedure has gained a lot of adherents as compared to open surgical aortic valve replacement (SAVR), a procedure reminiscent of Indiana Jones and the Temple of Doom. TAVR and SAVR are complimentary procedures; but for physicians they represent a bit of turf war, as cardiologists doing TAVR, continue to decrease the market share for surgeons doing SAVR.
With respect to mortality and complications most of them occur rather quickly for both techniques so most studies report the 30-day mortality. But while most deaths occur early, deaths following the procedure continue to occur for several more weeks. The healing response to surgery of any type, and that includes TAVR is roughly six weeks so many have suggested that a 90-day mortality would be a more accurate measure. Medicare has kind of moved towards the 90-day interval because all newer payment models, involving bundled care, cover 90 days, not 30.
With that context in mind, the researchers looked at hospital rankings based upon 30, 90 and 365 days. Spoiler alert, for those of you acquainted with regression to the mean [1], you are about to see a great example. The data came from Medicare covering 2012 through 2015 involving all cases of aortic valve replacement. There were 30,329 TAVRs at 184 hospitals and 26, 021 SAVRs at 191 hospitals. This represents about 3% of all US hospitals and should give you a good sense of how technically complex and regionalized this care is – these are very good hospitals to begin with.
Using the 30-day mortality, 14.6% were considered the best or the worst, with the remaining 70.8% in the middle. The top group had “significantly” younger patients (actually the difference was 6 months) with fewer comorbidities – they had less health baggage. The top performers had statistically fewer cardiac arrests, transfusion requirements and acute kidney injuries, but those same hospitals implanted statistically more pacemakers. Finally, those bottom hospitals had more readmissions and greater 90-day and one-year mortality.
But a funny thing happened when the hospitals were re-ranked by their 90-day and one-year moralities. Here is the graphic
 When ranked by their 90-day outcomes, nearly half of the top hospitals declined in their performance, 30% of the bottom hospitals improved. When using the one-year survival 77.8% of the top hospitals declined while 44.4% of the bottom hospitals improved. As I said, regression to the mean.
When the percentage change was calculated 97 of the hospitals were in a clinically significantly different mortality category at 90-days compared to their 30-day baseline standard for reporting – and
“their mortality rankings were more likely to be substantially worse at 90 days than improved by a ratio of 3:2.”
The data for procedurally related mortality did, as I suggested, follow a longer timeline than the 30-day outcomes would suggest.
Here is the graphic and as you can see, mortality plateaus out at about 90-days. 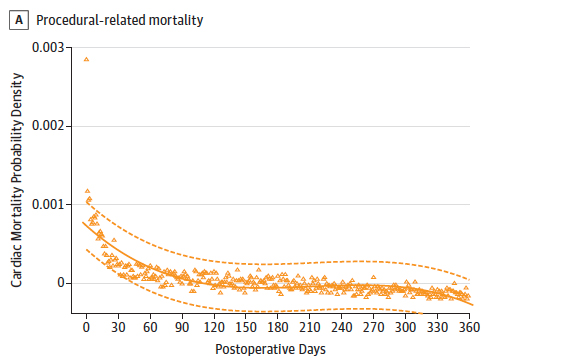
While I haven’t bothered to discuss the SAVR data, the regression to the mean was very similar.
What can we conclude?
Most importantly 30-day metrics can significantly underestimate outcomes and they probably should have little continuing role in reporting “quality.” 90-day data is just better, it captures “more of the episode,” perhaps that is why Medicare chose that time frame. The second message is that hospital rankings, like other statistical measures regress to the mean or towards “mediocrity.” Patients and those groups that make a cottage industry out of hospital rankings, and I am thinking specifically of US News and World Reports, would do well to consider how well rankings reflect reality.
[1] “regression toward (or to) the mean is the phenomenon that arises if a random variable is extreme on its first measurement but closer to the mean or average on its second measurement and if it is extreme on its second measurement but closer to the average on its first. To avoid making incorrect inferences, regression toward the mean must be considered when designing scientific experiments and interpreting data. Historically, what is now called regression toward the mean has also been called reversion to the mean and reversion to mediocrity.” Wikipedia
Source: Utility of 90-Day Mortality vs 30-Day Mortality as a Quality Metric for Transcatheter and Surgical Aortic Valve Replacement Outcomes JAMA Cardiology DOI: 10.1001/jamacardio.2019.4657

Chuck Dinerstein, MD, MBA
Director of Medicine
Dr. Charles Dinerstein, M.D., MBA, FACS is Director of Medicine at the American Council on Science and Health. He has over 25 years of experience as a vascular surgeon.


