Medicare is running a pilot program capping the monthly cost of insulin, but there is no federal regulation in sight. In the absence of federal leadership, eight states have capped monthly insulin costs at between $30 and $100.
"The pharmaceutical pricing system is just rigged, and it’s rigged so patients pay more each year. Competition does not drive prices down." Senator Ron Wyden of Oregon.
While the conventional narrative is that the three remaining manufacturers, which control 90% of the market, intentionally or unintentionally acting as a cartel, have allowed the price to rise. Once you follow the money as a study in JAMA Health Forum did, you realize that Senator Wyden is correct. It is a rigged and purposefully opaque system. Let’s begin with a simplified flow of the money.

All those monies flowing back and forth are reminiscent of money laundering and explain much of the lack of transparency in pricing; terms of the trade further this obfuscation. Wholesale acquisition cost or WAC is what we might consider the sticker price. But only suckers pay sticker price (at least until the pandemic when cars, new or used, are scarce). For patients, the price is a combination of their out-of-pocket expenses and the cost of their insurance.
The researchers sought drug pricing information through various sources, including two recent initiatives on insulin price transparency in Ohio and Nevada. Other sources included CMS Rebate Summaries and Part D claims, Medicaid Drug Spending Reports, reports by the Drug Channel Institute (a consultancy that compiles drug data), and public filings by manufacturers and insurers.
Some of the data are more certain than others, but it provides a very insightful view of where the money goes.
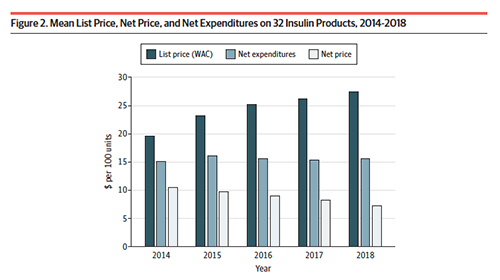 As you can see, the list price, the price charged by manufacturers has been steadily increasing. Before we conclude that they are the culprits, remember that the list price is only for suckers; it has little basis in actual spending. From 2014 to 2018, the list price of 100 units of insulin rose 40% to $27.45. (There is no typical insulin dosage but we can roughly assume that 100 units represents a weeks worth of insulin)
The net price (the cost after all the deductions and taxes), the closest we can get to the actual cost of insulin, decreased 30.8% to $7.29 for those 100 units of insulin. There is a very significant price difference in the movement of insulin from the manufacturer to the patient. That price is captured in net expenditures – the money, through out-of-pocket costs, insurance premiums, and taxation that is actually spent. The difference between net expenditures and net prices is the portion taken by all intermediaries, manufacturers, wholesalers, health plans, and are real villains, pharmacies, and the pharmacy benefits managers or PBMs.

This second chart shows how the intermediaries split the spoils. Stacked graphs like this are poor visualizations of this type of information so let me put some numbers to the image.
The losers
- Manufacturers received 33% less payment for their product – they receive 46.73% of the money but they have actual expenses; they actually must produce the insulin.
- Insurers too have received less, a 25% reduction – their share is 10.4%
The winners
- Wholesalers have increased their percentage by 75%, to 8% of the money
- PBMs have increased their percentage 154% to 14.3%
- Pharmacies have increased their percentage 228% to 20.4% of the money
There are further entanglements, as pharmacies and health plans can own PBMs, so we needn’t emphasize their declining share. Over the period, the actual net price for insulin has risen only 3%.
“The widening gap between net expenditures and net prices suggests that increasing profits of distribution system participants are responsible for the increase in insulin costs.”
How much? In 2014, the intermediaries took 16.5%, today they take 42.9%. What exactly are they doing for all that money? You needn’t be a social justice warrior or a market-based libertarian to recognize that something is amiss and that we are paying a great deal of money for the transaction, not the product. Senator Wyden is correct, the system is rigged, and we should be furious.
Source: Estimation of the Share of Net Expenditures on Insulin Captured by US Manufacturers, Wholesalers, Pharmacy Benefit Managers, Pharmacies, and Health Plans From 2014 to 2018 JAMA Health Forum DOI: 10.1001/jamahealthforum.2021.3409

Chuck Dinerstein, MD, MBA
Director of Medicine
Dr. Charles Dinerstein, M.D., MBA, FACS is Director of Medicine at the American Council on Science and Health. He has over 25 years of experience as a vascular surgeon.


