
You can catch part I here.
MME aid clinicians in altering ineffective therapy to find equianalgesic medications that may be more effective in one patient over another. Unfortunately, as we have seen in the origins of MME, those numerical values disguise their underlying uncertainty.
- Conversion factors change over time – a textbook’s hydromorphone’s conversion, from parental to oral, going from a 5-fold to 2.5 fold difference in 8 years [1]
- Equianalgesic doses differ in the order in which drugs are substituted for one another. “Our data suggests that [hydromorphone] is 5 times more potent than [morphine] when given second (morphine-hydromorphone), but is only 3.7 times more potent when given first (hydromorphone-morphine).”
- Online MME calculators all provide different answers to the same question. In a study, trainees in palliative care were asked to use an online opioid conversion calculator to determine MME conversions in “realistic patient cases.”
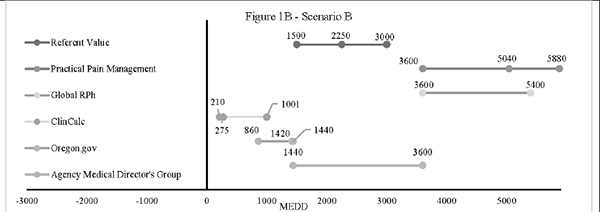 In this scenario, students calculated a conversion from intravenous hydromorphone to oral morphine in a patient dying of cancer. Look at the range of conversion values; the variability is too great to be confident in your medical decisions.
What do reported MMEs measure?
Not only do MME calculators vary, but research studies characterize MME in very different ways. This study was reported as part of the CDC’s recent scientific review of their opioid guidelines. The researchers began with a simple question, how many patients were taking a “high dose” of pain medications, defined as >90 MME?
The researchers applied formulas taken from four studies, all reporting daily MME, all using different, reasonable calculations to some real-world data. [2] Specifically the Prescription Drug Monitoring Programs (PDMP) of California and Florida from July to September 2018.
- Roughly 9.5 million opioid analgesic prescriptions among 4 million adults.
- 7.9 prescriptions per 100 Californians, 8.7 prescriptions per 100 Floridians.
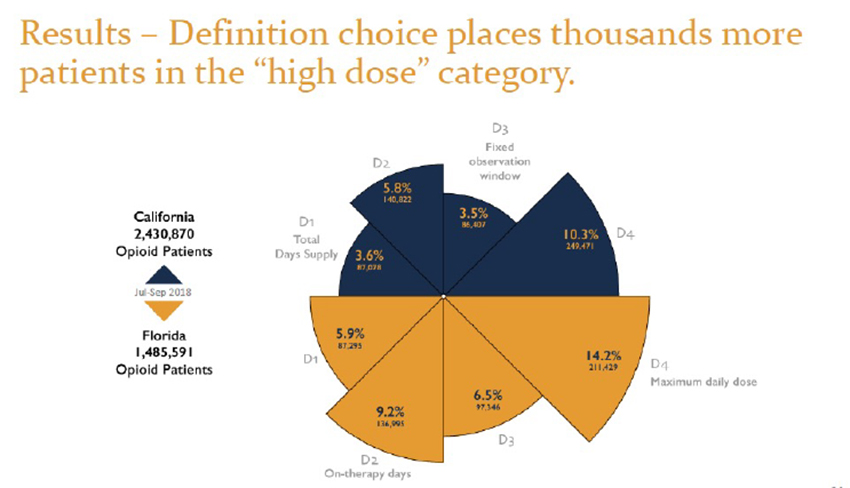
Depending on your calculation method, the number of individuals receiving more than the recommended “safe” amount varied from as low as 3.6% to as high as 14.2%. The inconsistency makes for “Alice in Wonderland” calculations. These differing results, due only to a differing calculation, are often lost in translation, both in the popular press and, more crucially, in the legislatures.
The Take-Away
To the researchers:
“Unlike the zealots who are heavily responsible for recent opioid-prescribing guidelines and trends, we do not necessarily believe that researchers who continue to rely upon the concept of MEDD [milligram equivalent daily dose] are being disingenuously agenda-driven in doing so. Rather, researchers’ use of MEDD continues to be commonplace, simply because doing so has been conveniently accepted rather than methodically questioned. It is easier to ignore pharmacogenomics and individualized therapy, and “lump” all opioids and patients together based on the denominator of MEDD, as opposed to comparing the impact of an intervention on individual consumption of opioids, such as morphine, fentanyl, and methadone. However, just as prescribing guidelines are based on flawed formulas and evidence, invalid concepts can make research invalid. We are thus compelled to consider whether outcome research that continues to rely upon the concept of MEDD is also invalidated by such.”
The MEDD myth: the impact of pseudoscience on pain research and prescribing-guideline development
To the legislators:
“MME per day is enshrined in state laws, with the assumption that it is a standardized metric.” [emphasis added]
Nabarun Dasgupta, MPH, PhD
Gillings School of Global Public Health UNC-Chapel Hill
Clearly, that assumption is wrong. MMEs provide a pseudo certainty that has harmed patients living with chronic pain. Legislators must revise or eliminate the harmful laws they enacted based on a misunderstanding of the 2016 guidelines.
To physicians:
"Statistics are people with the tears wiped away"
- Irving Selikoff, MD
We can not ignore our patient’s tears. It is time we practice the art and science of medicine.
[1] Comparison of 2010 and 2018 editions of Demystifying Opioid Conversion Calculations
[2] For a patient receiving 30mg of extended-release oxycodone twice a day for 30 days and one 5mg oxycodone twice a day for “breakthrough” pain, the total MMEs given to the patient is 2,805. Here are the results of applying each of the four formulas
Total Days’ Supply 2,805/37 = 75.8 MME/day
- The two prescriptions amount to 37 days. This calculation underestimates daily MME when opioids are used in combination – a not infrequent prescribing pattern.
On Therapy Days 2,805/30 = 93.5 MME/day
- The prescription is treated as 30 days; the overlapping days are included. This is the method used by Health and Human Services
Defined Observation Window 2,805/90 = 31.2MME/day
- The prescription is treated as covering a therapeutic window, in this case, 90 days. This approach has some utility when considering varying prescriptions over varying time intervals. This is the most commonly used calculation in “evidence-based” studies.
Maximum Daily Dosage 105 MME/day
- This only considers the highest possible dosage; it ignores dates and days supplied

Chuck Dinerstein, MD, MBA
Director of Medicine
Dr. Charles Dinerstein, M.D., MBA, FACS is Director of Medicine at the American Council on Science and Health. He has over 25 years of experience as a vascular surgeon.


