
I last wrote about this in December 2020; here is the gist.
- THC used by itself or with CBD resulted in a 2.33cm increase in the degree of weaving in traffic for 40-100 minutes after "lighting up," compared to placebo, but there was no difference in the two groups at 240 minutes.
- CBD by itself did not significantly increase weaving at any interval.
- Speed of driving was unaffected under all conditions.
The researchers concluded that "… impairment was modest in magnitude and similar to that seen in drivers with a 0.05% BAC." What does the new research say?
The Current Study
They begin by pointing out that prior studies have all found more accidents. However, the “effect size” varied because of the time frames between legalization and the collection of crash statistics. So they focused on five early-adopter states, Colorado, Washington, Oregon, California, and Nevada, and traffic statistics between 2009 and 2019. Traffic accidents came from state databases, and vehicle miles traveled (VMT) from the Federal Highway Administration.
Federal sources also provided estimates of the percentage of front-seat vehicle occupants wearing seat belts and annual consumption of alcohol per capita. The six remaining western states [2] were used as the controls; the researchers pooled these results because of the smaller populations and traffic fatalities over the period. Finally, since traffic accidents have a seasonality, all results were adjusted to take that into account.
Before we go on, it is essential to recognize that many variables were involved in adjusting these numbers. These covariants included unemployment rates and seat belt use, associated with fewer injuries and fatalities; population younger than 25, maximum posted speeds, percent of rural roads traveled, and per capita alcohol consumption, all associated with increased injuries and deaths.
For the six control states, there were no trends over the 11 years
- Fatal crashes were 10.6 to 13.1 per billion VMT
- Injury crash rates 488 to 544 per billion VMT
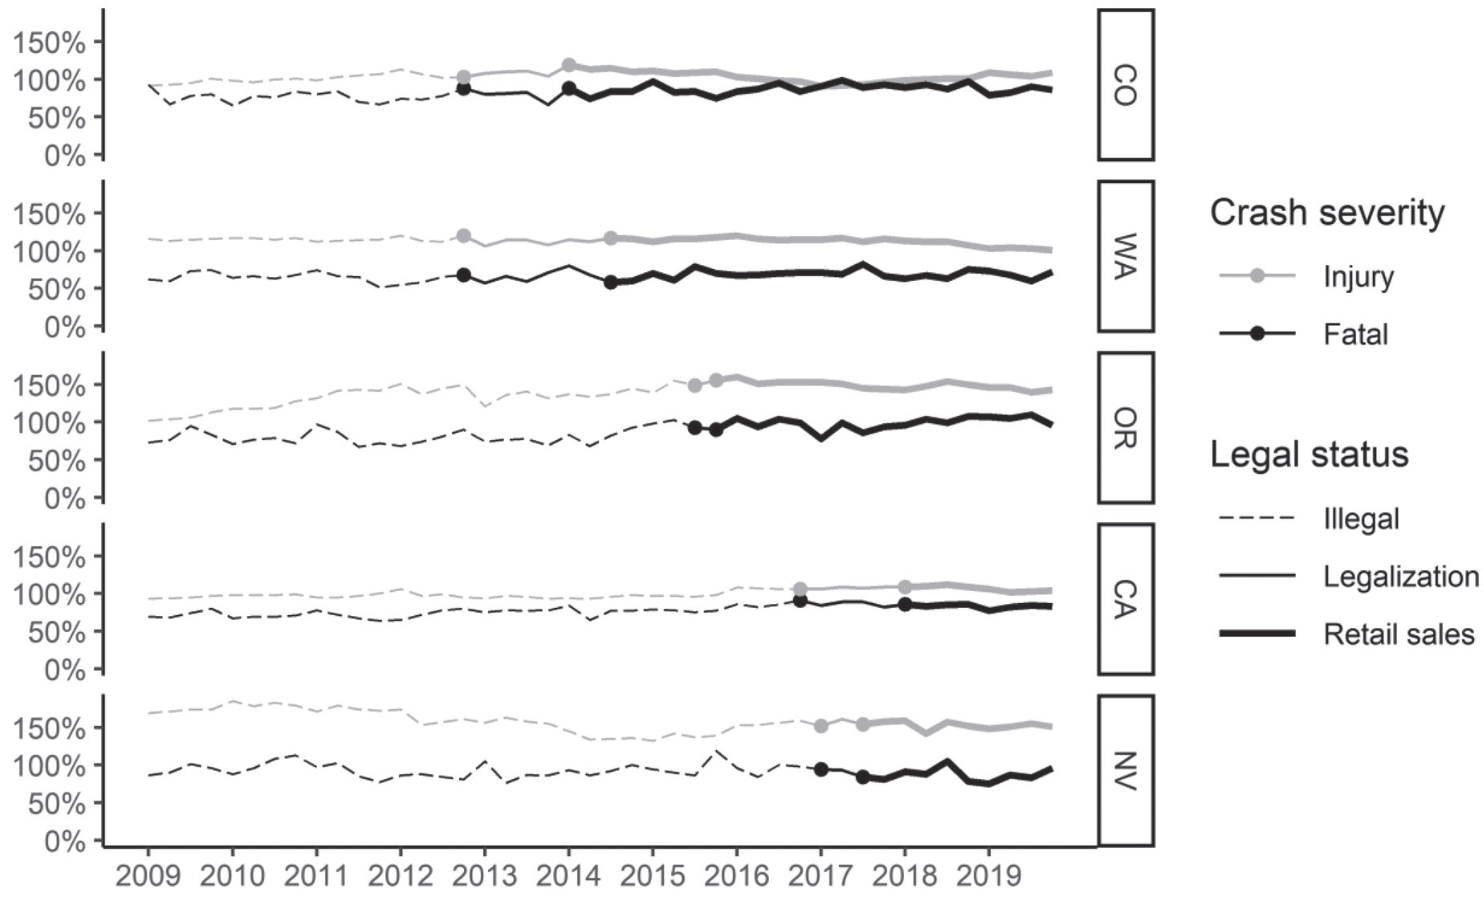 For the five study states, the results were different. At baseline, when marijuana was illegal, these states had fewer fatal accidents than the controls, but injury crash rates were higher. Legalization and retail sale of marijuana was associated with an aggregate
- 5.8% increase in injury crashes
- 4.1% increase in fatal crashes
As you might expect, the results varied by state. Four states experienced a net increase in injury crash rates, from Colorado’s 17.8% to California’s 5.7%. Only two of the five states had an increase in fatalities, Colorado again, at 1.4%, and Oregon at 3.8%; the remaining three saw decreases between 1.9% and 9.8%
What to conclude?
There is no apparent rhyme or reason to why some states see little change and others significant shifts. It could be the culture, more focused public service announcements, or greater law enforcement. We just don’t know. We may be on firmer ground in concluding that the impairment from pot, slowing your speed, and increasing your distance from the other cars ”may not be sufficient to avoid a crash, but it may be enough to reduce the severity of that crash.”
The researchers provided this as a comparator,
“the estimated effect of marijuana legalization on crash rates is only slightly lower than the estimated effects of lowering the legal drinking age in the United States from 21 to 18.”
[1] Tommy Chong and Cheech Marin can provide an example of that myth.
[2] Arizona, Idaho, Montana, New Mexico, Utah, and Wyoming. Alaska and Hawaii, with limited numbers of roads, were excluded.
Source: Changes in Traffic Crash Rates After Legalization of Marijuana: Results by Crash Severity Journal Of Studies On Alcohol And Drugs DOI: 10.15288/jsad.2022.83.494

Chuck Dinerstein, MD, MBA
Director of Medicine
Dr. Charles Dinerstein, M.D., MBA, FACS is Director of Medicine at the American Council on Science and Health. He has over 25 years of experience as a vascular surgeon.


