- There were 1,110,421 firearm fatalities during this period, 85% among males
- Blacks accounted for 26%, Hispanics 10%, and Whites 60.5%. Per the US Census, the percentages of the population are 13.6%, 18.9%, and 75.8%, respectively [1])
But today, we will let the pictures do the heavy lifting. The data are the mean and maximum rates of firearm violence per 100,000 people.
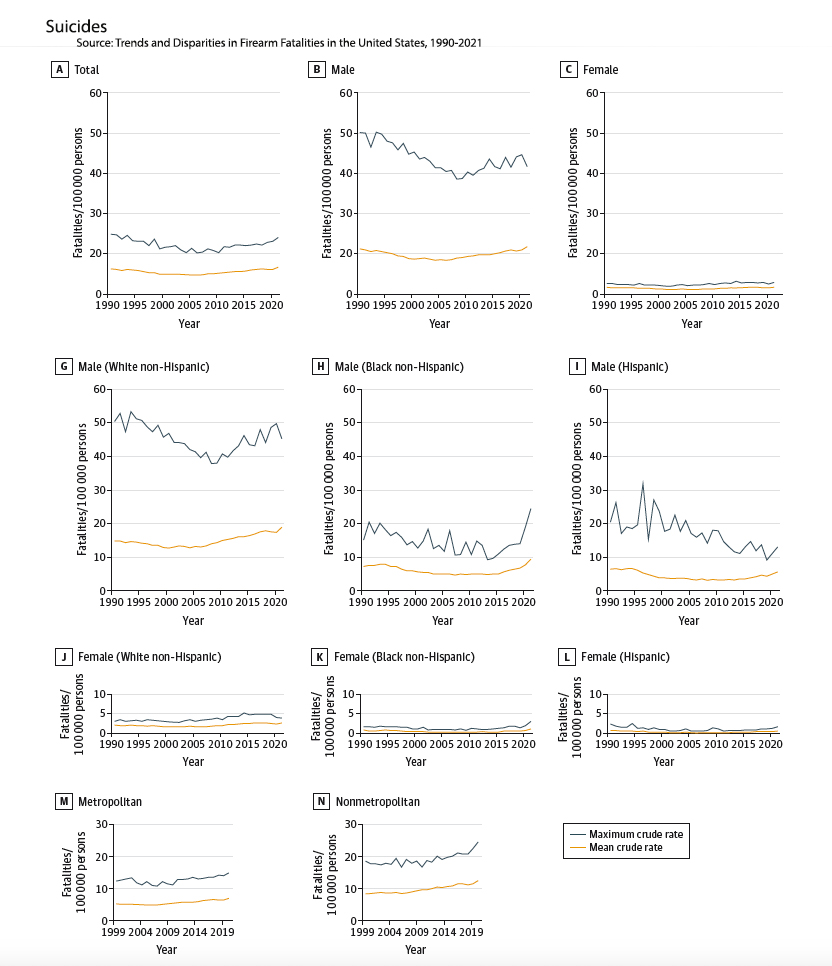
Males, particularly White non-Hispanic males, lead the way in suicides, roughly double that of Blacks and Hispanics. Rural suicides by firearm exceed urban deaths.
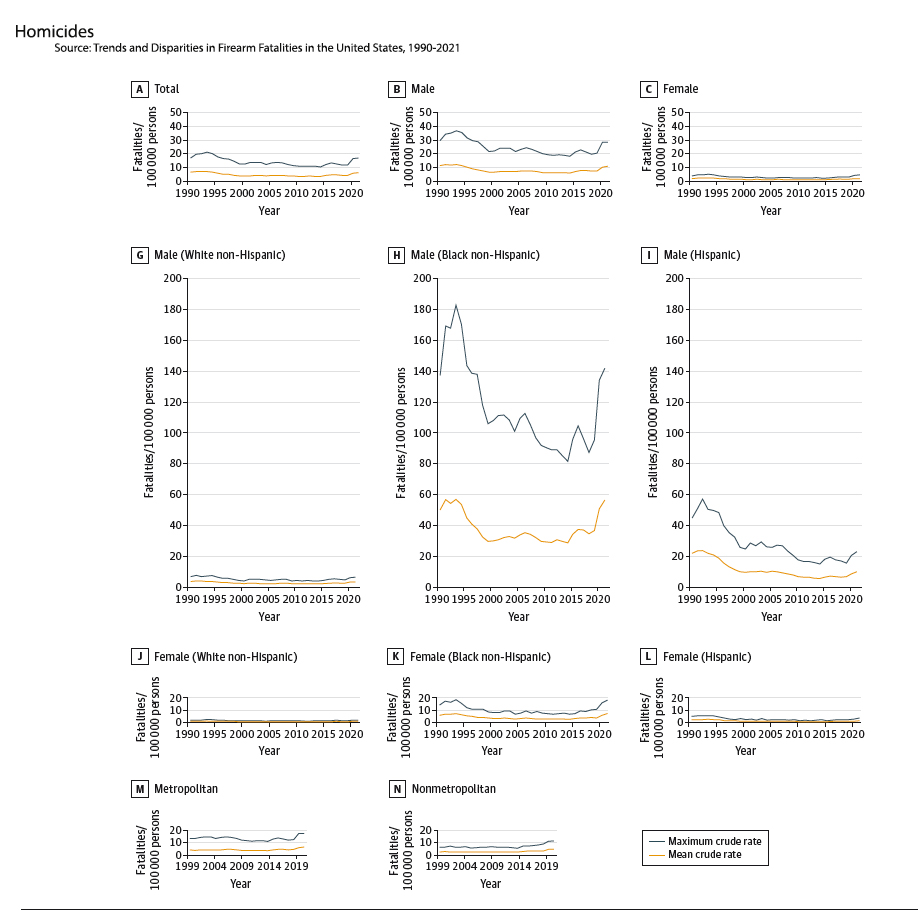
Homicides are actually down, compared to their high, but trending up. Again, males lead the way, but now Black non-Hispanic males, by a 20-fold increase. Metropolitan homicides are greater than those in rural areas.
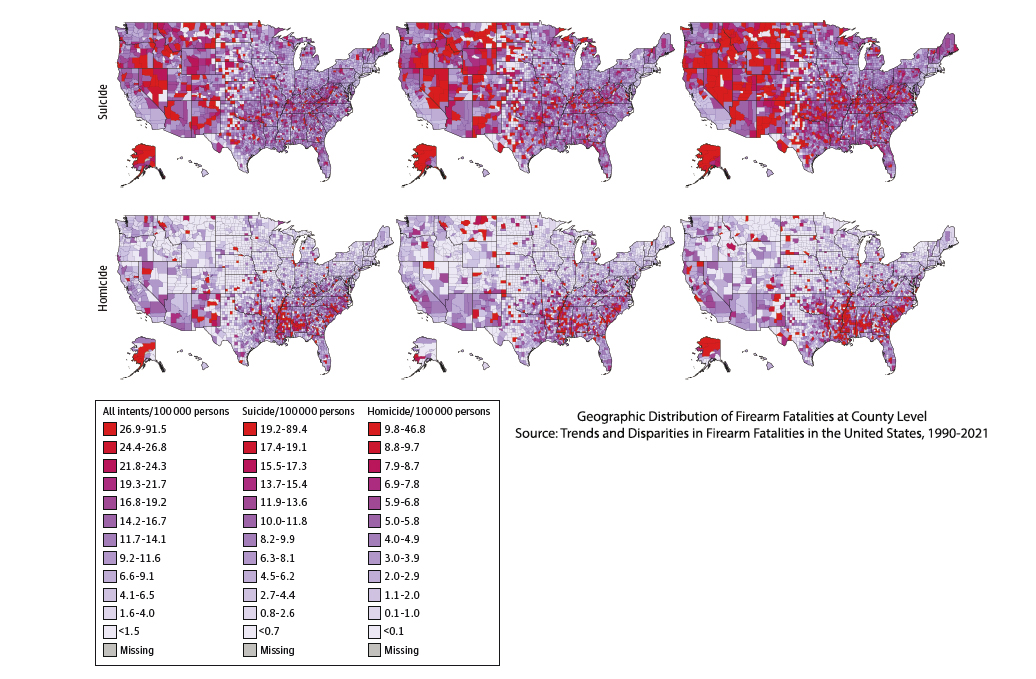
Here is the geographical pattern of these deaths. Roughly speaking, suicides are more of an issue in the western half of the country and a linear area stretching from the Central to mid-Atlantic. Homicides center in the South, but there are pockets throughout the West, especially in Alaska.
“In this multidimensional, nationally representative cross-sectional study of annual US firearm fatalities over a 32-year period, there were notable disparities in firearm fatalities by sex, race, ethnicity, and geography.”
[1] Disparities in percentages reflect the fact that Hispanics may be of many races.
Source: Trends and Disparities in Firearm Fatalities in the United States, 1990-2021 JAMA Network Open DOI: 10.1001/jamanetworkopen.2022.44221

Chuck Dinerstein, MD, MBA
Director of Medicine
Dr. Charles Dinerstein, M.D., MBA, FACS is Director of Medicine at the American Council on Science and Health. He has over 25 years of experience as a vascular surgeon.


