
Dr. Dinerstein wrote an initial response to the EWG study. But I noted several additional tried-and-true tactics EWG used to misrepresent the study's results.
Focusing on the wrong studies
Dr. Dinerstein noted that the EWG article uses data from two EPA assessments. However, both studies were carried out 8 to 10 years ago, presenting data that are no longer representative of the situation in the US. 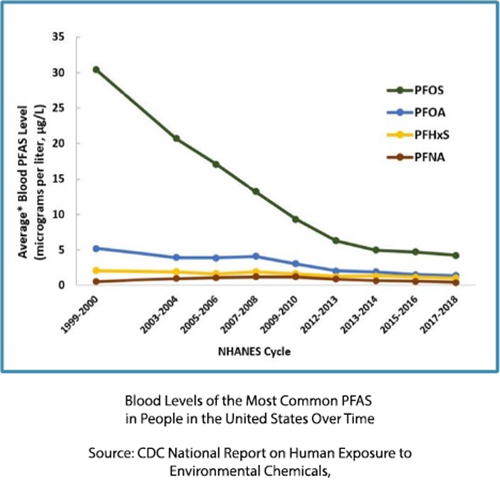 PFAS are no longer manufactured in this country. As shown in the figure, the PFAS in blood has been dramatically reduced over the years. Human blood levels are 70% to 90% lower than in 1999.
It may have been understandable to use the EPA data if no other data were available, but that is not the case; in fact, the EWG article references FDA studies but hides the results in supplemental tables – another tried-and-true tactic of deceptive articles.
These FDA studies measured levels of contaminants in food, including fish, sold in grocery stores and supermarkets across the US.
- Total Diet Study: Ongoing since it began in 1961, this FDA study monitors levels of nutrients, toxic chemicals, and pesticides in retail food from grocery stores and supermarkets. Since 2019, FDA has tested food for five or more PFAS. The EWG article used results of regional samples of seafood, including tuna, salmon, tilapia, crab, shrimp, cod, and catfish from 2019 and 2021, evaluating 16 PFAS. Most samples had no detectable levels of PFAS. The only samples that showed positive results were tilapia, shrimp, and baked cod, all at very low levels.
- FDA 2022 Seafood Survey: measured 20 PFAS in 167 samples of seafood, including tuna, salmon, tilapia, crab, shrimp, cod, pollock, and clams. Again, most samples had no detectable levels of PFAS. The highest levels were found in clams, imported from China, and crabs from Indonesia.
What did the FDA say about the results of the Total Diet Study?
“Based on the best available current science, the FDA has no indication that the five PFAS at the levels found in the limited sampling of foods collected for the Total Diet Study present a human health concern.”
- Analytical Results of Testing Food for PFAS from Environmental Contamination
If the EWG had chosen to include the FDA’s conclusion focusing their article on FDA instead of EPA studies, they could have accurately titled it: “Study Finds Very Low Levels of PFAS, Little Risk from Eating Fish.”
There appear to be two possible reasons for the differing results from the EPA and FDA studies:
- The EPA studies are 8 to 10 years old, and since PFAS levels have been dramatically decreasing over the years, they are most likely no longer representative of PFAS levels. The FDA data are much more recent (2019-2021); they should be more representative of the PFAS levels today.
- The EPA study tested fish from streams and rivers within the US, while the FDA tested fish from retail establishments. 95% of the fish we eat comes from retail sources. Since about half the fish sold worldwide today, including in the US, is farm-raised, farm-raised fish may have lower levels of PFAS than those from natural environments. This is a hypothesis because it runs counter to the narrative that dominates the media that wild fish are healthier than farm-raised fish.
Units of Measure
The EWG presents its results in nanograms per kilogram (ng/kg) to make the results seem extremely large.
“The median total targeted PFAS in fish fillets from rivers and streams across the United States was 9,500 ng/kg, with a median level of 11,800 ng/kg in the Great Lakes.”
Now a few conversions:
- 1 ng/kg = 1 parts per trillion (ppt); 1 ppt is about one ounce in 7.5 billion gallons of water
- 1 part per billion (ppb) = 1000 ppt; 1 ppb is about 1 pound in 120 million gallons of water
- 1 part per million (ppm) = 1000 ppb; 1 ppm is about 8.34 pounds in a million gallons of water.
If they had used ppb as their unit of choice, “The median ….was 9.5 ppb, with a median level of 11.8 ppb…” or how small the results seem if presented in ppm, “The median … was 0.0095 ppm, with a median level of 0.0118 ppm….”
Health Advisory Comparison
The article compared the amount of PFAS in freshwater fish with EPA’s interim Health Advisory for water, concluding that
“even occasional consumption of several fish meals a year would likely translate into PFOS exposure from fish significantly greater than exposure from water.”
As I have previously written, the EPA’s updated Health Advisories of 0.004 ppt (0.000004 ppb) for PFOA and 0.020 ppt (0.000020 ppb) are so low that they are unmeasurable by current techniques and are not based on credible science. To date, no human studies have shown that PFAS causes adverse health effects.
The EPA based their Health Advisories on a study that showed an association between changes in antibody levels in children in the Faroe Islands and PFAS levels, but no adverse health effects were noted. Most other countries (e.g., Australia, U.K., Canada) have not used changes in antibody levels to set their “safe” levels, resulting in health values of 100 ppt and above.
Additionally, the comparison makes little sense because the EPA’s Health Advisories are for drinking water only, not for fish consumption. It appears that the EWG, not caring about sound science, wanted to compare the levels in fish with the lowest “safe” level they could find (i.e., EPA’s Health Advisories) so they could make the results look as bad as possible.
Checking the Facts
Let’s use the Washington Post’s fact checker rating system where the facts behind political rhetoric are given Pinocchios:
- one Pinocchio: some shading of facts
- two Pinocchios: significant omissions and/or exaggerations
- three Pinocchios: significant factual error and/or obvious contradictions
- four Pinocchios: “whoppers”
Here are my ratings:
Content: Two Pinocchios. Although the article is mostly factual, it presents many exaggerations and omits discussion of important data, such as that from the FDA.
Modeling: Three Pinocchios. The article uses skewed data and inaccurate assumptions to get the desired result.
Presentation: One Pinocchio. The article presents the results in the smallest units possible to make them seem very scary and hides the data in supplemental tables. In addition, the article hides EWG’s obvious conflict of interest – the more “terrifying” the results, the more money they receive from grants and public fund-raising requests.
This is an example of a seriously flawed study and press release broadly disseminated and picked up by major news outlets. For their readers, it is difficult, if not impossible, to distinguish fact from fiction. The obligation falls on the news outlets to do some fundamental analysis before simply running a sensational headline.