What are carbon credits?
Carbon credits are a free-market answer to help mitigate greenhouse gas emissions and combat climate change. Carbon credits are not a free pass. Companies are limited in the number of these tradable permits that represent the right to emit a certain amount of greenhouse gases, typically measured in metric tons of carbon dioxide or its equivalents, like nitrous oxide. They were established by the UN’s Kyoto Protocols, which placed individualized caps on greenhouse gas (GHG) emissions. While authored in part by Vice President Gore and signed by President Clinton, the Kyoto Protocols have never been ratified by the US Senate.
Carbon credits are not a carbon “sin” tax, where demand is reduced by increasing price. In most instances, these additional revenues go to a general fund rather than targeted to other means of reducing demand, like electrifying public transportation.
“Shell or British Airways, for example, can then buy these credits from the project and use them to claim that people can drive or fly ‘carbon-neutral’.”
There is an unregulated, voluntary carbon market that many corporations use to “reduce” their carbon footprint as they transition away from the actual output of GHGs. Carbon credits can come from
- Countries using particularly dirty energy as they transition to cleaner fuels. That is why India and China are the two largest sellers of carbon credits.
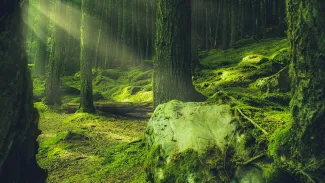
- “Natural” carbon sinks, like forests, kelp, and seagrass. Regenerative farming is also a source of carbon credits.
- Technological alternatives that retrieve and store carbon, like free-air capture. Technologic solutions are five-fold or more expensive than using those natural carbon sinks. [1]
How it works
A project developer, state actors, private companies, conservationists, or private individuals, identify an activity that will result, in theory, in the sequestration of carbon. Reducing Emissions from Deforestation and Degradation (REDD+), are particularly popular because forest-based carbon credits are more tangible than visualizing a ton of methane. REDD+ projects must use a “standardized” methodology to attest that the forest is under threat and calculate the carbon credits for not cutting down the trees.
Third-party auditors hired by the developer attest to compliance with the methodology, not to whether the methodology conforms to reality. With an auditor’s statement, the developer turns to a certifier, which certifies the audit and provides a market to issue and sell the carbon credits. The certifier also monitors the project to ensure compliance so that credits can be issued over the project's life.
You would think that this business would be squeaky clean with all that oversight and auditing; you would be incorrect.
Verra
Verra, a company that developed the most widely used methodology, Verified Carbon Units (VCU), is the predominant player in authentication, approving about 75% of global carbon credits. Many have been purchased by corporations wishing to signal “their commitment” to the environment or to offset their carbon use, including, as the Guardian reports, “Disney, United Airlines, Air France, Samsung, Liverpool Football Club, Ben & Jerry’s, Netflix and Chevron.” Over 15 years, Verra has issued 1,000,000,000 carbon credits. They charge ten cents per credit for their efforts, meaning roughly $100 million in revenue.
To be fair, companies purchasing voluntary carbon credits have “more ambitious emissions reduction targets and [do] more across the board to cut emissions compared with companies that did not.”
Carbon offsets vary significantly in quality because they are intangible -- there is no product.
Forest carbon credits cumulatively accounted for 44 percent (or more than 680 million tons of CO2 equivalence) of credit issued on the voluntary carbon market as of 2022, higher than any other project type.
Historically, surveyors manually measured tree density in sample plots and extrapolated these numbers to determine forest coverage. But many areas felt to be REDD+ eligible are challenging for surveyors to reach (parenthetically suggesting they may not be at risk at all), so newer technologies have been deployed that reduce thecost and maintain, if not boost, the accuracy of these baseline tree assessments. Those technologies include light detection and ranging, the LIDAR found in autonomous vehicles. Using machine learning, combining the findings of manual surveys and LIDAR readings has created satellite imaging to assess the changing “aboveground biomass and changes in forest cover.” This helps to establish a baseline for the area of concern and a means of measuring change over time.
A critical component of carbon credits is additionality, meaning that deforestation and anthropogenic degradation would have occurred without those credits. There is an assumption that additionality does not change over time, but this has proven untrue - when additionality decreases, carbon credits become overstated.
Forests are susceptible to fire, drought, and disease, so the source of credits are not necessarily durable. Developers reserve non-tradable credits to hedge “unforeseen losses in carbon stocks” in REDD+ projects. A recent study noted that 20% of California’s 100-year reserve of non-tradable credits literally went up in smoke during the past decade. [2]
Scientific studies of REDD+ outcomes
Using geospatial satellite data from Landsat between 1990 and 2019, researchers looked at deforestation and forest degradation across several Verra-accredited projects. Rather than use the control area selected by Verra, “a counterfactual area of forest that has similar deforestation threats to the project area,” the researchers chose an area “controls were exposed to the same drivers of deforestation.”
They quantified areas as
- Undisturbed - not been disturbed over the entire interval.
- Degraded - temporarily disturbed for up to 30 months due to anthropogenic and natural causes, e.g., selective logging or fires. The researchers note that “short-term disturbance events in the optical imagery may have enduring impacts in carbon stocks and forest structure.”
- Deforested – Long-term (>30 months) complete removal of forest cover.
- Leakage – the shifting of deforestation out of project areas, an acknowledged risk. Optical changes in a 10-kilometer buffer zone around the project area characterized “local” leakage.
Background deforestation rates were based on country-level forest loss and classified as high or low compared to mean annual deforestation across the region over 30 years.
- 85% of sites demonstrated a 0.22% annual absolute reduction in deforestation compared to 0.36% for controls. For those that like bigger numbers, the relative reduction was 47%
- 82.5% of sites demonstrated a 0.41% annual absolute reduction in degradation compared with 0.80% for controls. The relative decrease in degradation was 58%
- No local leakage was identified.
- Reductions were more significant in areas of higher risk than those at lower risk of deforestation.
These projects reduced forest loss by 66,754 hectares [3], roughly the size of New York City, and degradation by 116,910 hectares, an area slightly larger than Paris. While these numbers seem significant when considering the area for all the carbon credits issued, they reduced deforestation by only ∼0.8% and degradation by ∼1.4%. While most of those savings were in areas of greatest risk, low-risk regions accounted for nearly 80% of the carbon credits. As the authors conclude,
“Our analysis provides promising evidence that site-based REDD+ projects have helped reduce deforestation, particularly in areas of high deforestation threat. Yet, emissions reductions in the 40 REDD+ projects analyzed represent a tiny fraction of global emissions. In total, they amounted to about 0.01% of 2018 emissions, or 0.13% of emissions from tropical deforestation in 2013.”
A possible explanation for the disparity between carbon credits’ promise and delivery could be found in a second study. The researcher focused on the baseline scenarios constructed to establish the carbon saved, which determines the number of carbon credits available to purchase. As they write
“These baseline scenarios typically assume a continuation of historical deforestation trends, and thus eventually become unrealistic counterfactuals as the regional economic and political context change.” [emphasis added]
In this modeling study, researchers created “synthetic” controls reflecting “best matches of historical deforestation trends.” They looked at Brazilian Amazon, which generated 5.4 million carbon credits for REDD+ projects.
“We find no systematic evidence that the certified carbon offsets claimed by the voluntary projects in our sample (with the exception of Maísa) are associated with additional reductions in deforestation in the REDD+ areas above and beyond the background reduction in deforestation achieved in the Brazilian Amazon over the same period.” [4]
The baseline loss of forest overestimated the savings of carbon credits when considering the changing reduction in additionality. These areas were no longer at risk for deforestation.
Carbon credits have protected areas, just not anywhere near the percentages claimed; carbon credits are more a bumper sticker than lifestyle. Given your belief in human nature and political leanings, this massive disconnect between what is promised and delivered may be due to “greed” by the accreditors, the virtue signaling by corporations like Chevron and Ben and Jerry’s, or the complexity of calculating carbon credits. They are not the free-market bridge that was hoped for. Continuing to spend money on carbon credits diverts funding from finding more helpful alternatives.
[1] Fun fact: One of the biggest sellers of carbon credits under California’s Air Resources Board program is Tesla. In 2022 Tesla brought in a revenue of $1.78 billion from those credits.
[2] “Coldplay bought 10,000 mango trees in India to offset an album, only to see many of them die several years later.”
[3] A hectare contains approximately 2.4 acres
[4] The one exception, a project called Maísa, did show savings in deforestation, but they believe that 40% of the 50,000 carbon credits would have been saved anyway.
For fun, you can calculate your carbon footprint here; perhaps you can issue carbon credits too.
Sources: Revealed: more than 90% of rainforest carbon offsets by biggest certifier are worthless, analysis shows The Guardian
Can We Count on Forest Carbon Credits? Rocky Mountain Institute
A global evaluation of the effectiveness of voluntary REDD+ projects at reducing deforestation and degradation in the moist tropics Conservation Biology DOI: 10.1111/cobi.13970
Overstated carbon emission reductions from voluntary REDD+ projects in the Brazilian Amazon
PNAS DOI: 10.1073/pnas.2004334117
The Carbon Con The Guardian
Carbon offsets - how do they work, and who sets the rules? World Economic Forum

Chuck Dinerstein, MD, MBA
Director of Medicine
Dr. Charles Dinerstein, M.D., MBA, FACS is Director of Medicine at the American Council on Science and Health. He has over 25 years of experience as a vascular surgeon.


