Prescription drugs represent 10% of our healthcare costs, $325 billion in 2015. The alarming cost of drugs is the least transparent of our healthcare costs, but impact patients the most. 50% of us take prescription medications and with few exceptions out of pocket payments for pharmaceutical are greater than other out of pocket costs like surgery or hospitalization. It is a cost that patients constantly encounter and underlies the incessant concerns about pharmaceutical prices. The response by the system creating cost-sharing patches - rebates, discounts, co-payments, and deductibles - have completely removed the meaning of list price. [1] The real cost of drugs is impossible to know. The Brookings Institute with the Schaeffer Center for Health Policy and Economics presented an online discussion of drug costs yesterday. I wanted to share the work of Neeraj Sood et al. in a paper, The Flow of Money through the Pharmaceutical Distribution System. They used Securities and Exchange Commission (SEC) required filings by corporations to ‘follow the money.’ Let’s join them.
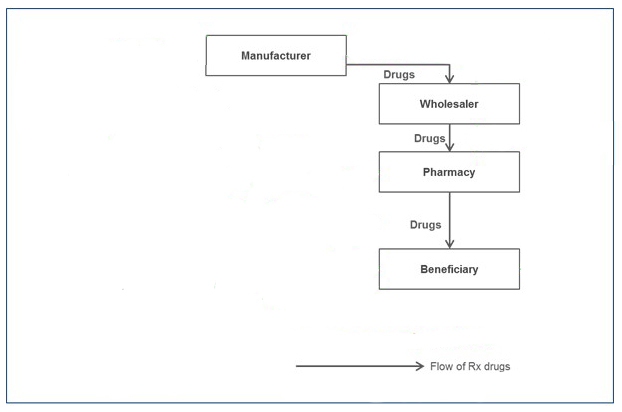
It began as a simple market
But over time other players, involved in the payment or acting like intermediaries got involved, it became more complicated.
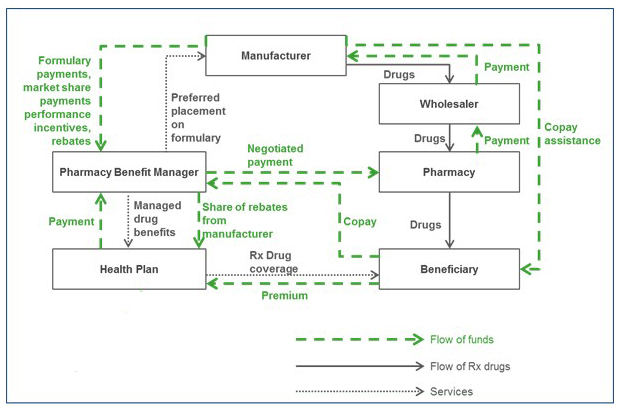
But even with this complexity of flowing monies and pharmaceuticals, something is missing, can you see what? All the arrows point at other points in the system, what makes this perpetual motion system work?
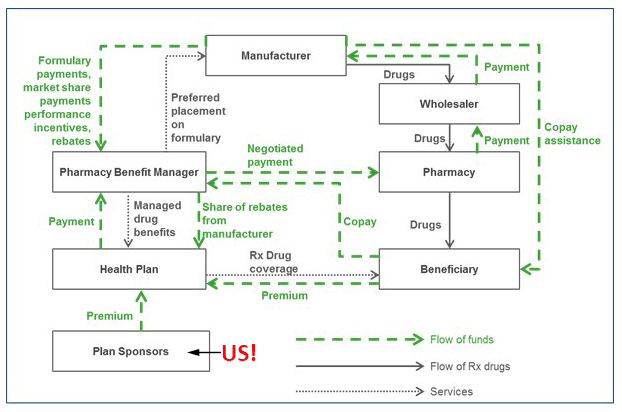
Plan sponsors! The system goes round and round funded by you and me.
Sood’s data set was incomplete because some of the players are private, not public companies, but it is certainly representative.
In explaining the flow of money, Sood uses two economic definitions quantifying the components of the spread. The Gross margin is simply (Revenue-Cost of goods sold)/Revenue. Dividing by revenue lets us compare companies with varying revenues. The more relevant definition is the net margin which in addition to the cost of goods sold includes operating expenses, like R&D, marketing, and administration. Net margin is what we would consider profit. Here is the flow of money
It is not as complicated at it appears. The blue is a payment of $100 for a pharmaceutical and how it changes, the aqua blue the gross margin and the orange the net margin. The zero for the wholesaler’s net margin is really 32 cents. The graphic lets you see everyone’s spread; in essence, these five players split a profit of $23 out of our $100 spent. The bulk goes to the manufacturer ($15) leaving the other players to split the remaining $8.
“Put another way, more than $1 out every $5 spent on prescription drugs goes towards profits in the pharmaceutical distribution system. While we cannot say definitively whether any sectors are making excessive profits, our results are consistent with profit-making behavior on the part of all sectors.”
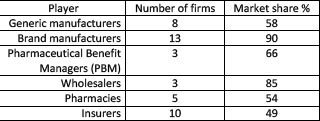
There are two pharmaceutical markets, brand and generics. They feature the same players, but monies are parceled out differently. Manufacturers have greater gross margins for branded drugs, $58 vs. $18 for generics, consistent with patent protection and the how generics are commodities driven to the lowest price possible. Insurers show little change ($19 for branded vs. $17 for generic) in their gross margins. But the three middlemen, PBMs, pharmacies, and wholesalers all have greater gross margins in the generic market. Typically for gross margins, PBMs have a 4-fold increase, wholesalers an eleven-fold multiple and pharmacies a 12-fold multiple. Is that why all three push generics as cost-saving?
Are profits excessive?
Consolidation results in monopolies for sellers and increasing market power bordering on monopsony [2] for buyers. If you refer to the table presented earlier, you can see how few companies are involved in this market. Risks taken by the player are added into the spread to hedge against loss. The costs associated with bringing a drug to market by the manufacturer is the largest source of risk. Wholesalers and pharmacies claim danger of being stuck with too much inventory while insurers cite the risk of insuring patients requiring too many high price drugs. PBMs have no risk. Finally, considered the net profits of comparable sectors; asking yourself, do the comparables make the player's profits seem too high? Branded manufacturers had the highest net margins within their sector, followed ironically by tobacco, alcoholic beverages and then generic pharmaceutical manufacturers. Drug wholesalers were comparable to food wholesalers. Health insurance had lower net margins than life, property, casualty and general insurance. Pharmacies were near the top of their sector, beaten out by building supply but more than retail automotive sales. PBMs were such a unique player that comparables were difficult to identify, the only one identified, real estate brokers, had higher net margins or profits.
Don’t tax you, don’t tax me, tax the man behind the tree.
In the subsequent panel discussion, representatives of the players expressed their views, all agreeing that there was no silver bullet solution. Each protected their turf while suggesting the other players might contribute their ‘excess’ profits back to the ultimate payer, you and me.
The consumer representative of consumers suggested that competition in the market would not improve the patient’s situation because when you are ill and simply want to feel better – feeling better trumps price. She though price regulation might be part of the solution. She noted that ‘natural’ monopolies form around orphan diseases and drugs, resulting in a small market with extremely high costs per patient.
The insurer’s representative addressed ‘broader affordability’ - the difficulty they had in balancing coverage for one with coverage for many. Value-based pricing (VBP), setting a drug's price by its efficacy, was a partial solution. VBP is already done in Europe. He felt that R&D costs by manufacturers did not warrant their subsequent profits.
Big Pharma’s representative indicated that patients already benefited from negotiated prices and that the 20% of costs by insurers could be reduced to decrease consumer costs while still protecting ‘innovation.' She suggested that the benefits system was outdated and that most of the money spent by consumers was early in the year when their deductibles were not yet met - allowing patients to pay for medication over the course of the year would be less disruptive.
The PBM representative wanted more competition and suggested that streamlining the approval process and time to market would increase the number of brand and generic drugs available. Competition, after all, is their input. With more products, there are increasing cost/efficacy variations, and it is these little differences that PBMs leverage for discounts.
Sood and his colleagues ended their paper with “efforts to control drug costs should focus on the rents enjoyed by all players in the distribution chain.” Rent has a specific meaning; referring to the excess payment made to keep the resource producing. Maybe our experiences with rent control can inform our thinking about drug prices.
[1] Except to individuals without insurance – in this instance, sticker shock is too mild a term.
[2] A monopsony is when a large buyer controls the market, an apt description of health insurers and of course, the federal government.

Chuck Dinerstein, MD, MBA
Director of Medicine
Dr. Charles Dinerstein, M.D., MBA, FACS is Director of Medicine at the American Council on Science and Health. He has over 25 years of experience as a vascular surgeon.


