Scientific thought advances by reproducibly testing a theory. In the last few years the increasing concern about the reproducibility of results, especially in the softer, behavioral and medical sciences, has gone from a murmur to loudly expressed concern. Most of that concern has surrounded the increasingly denigrated p-value and its role in publication.
Problem
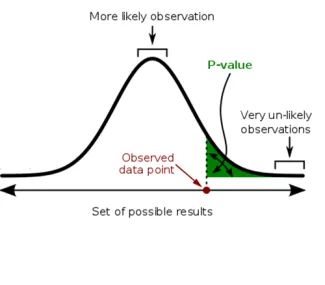
Consider a study by the National Need to Eat Kale Association, [1] who believe kale is a miracle food. In their study, a ‘healthy’ group eats kale, and an identical group does not. The groups seem to differ only in whether they eat scrumptious kale. The study finds that the kale eaters have fewer heart attacks with a p-value of <0.05. Up to now, we have been on track, but it is in the interpretation that the wheels come off the kale train. This ‘statistically significant’ p-value does not mean that there is a 95% chance that kale is good for you. It means that if kale has no benefit and the groups are indeed identical; there is a 5% chance that this result was just random, noise not signal. Another way to describe noise mistaken for a signal is the term, a false positive. A p-value <0.05 only tells you how extraordinary the results are. The concern of scientists is that p-values of <0.05 have led to more false-positive findings, when noise is mistaken for signal, reducing the reproducibility of experiments and cluttering up rather than clarifying the connection between theoretical prediction and actual observation. Moreover, even if we were to accept the idea that kale was better for you, the p-value does not tell you how kale works its magic on your heart, nor whether the experiment was well designed and controlled or even whether some data was ‘left out’ and resulted in a rosier kale outlook. What if, for instance, those kale eaters were so full after their heart-healthy meal that they did not ever eat dessert, unlike the control group that required a daily half-gallon of ice cream to mollify their kale deprivation.
Solutions
One group has suggested changing the threshold for ‘statistical significance’ of the p-value from 0.05 to 0.005, “to keep false positives from creeping into social sciences and biomedical literature," [2] hopefully increasing the reproducibility of scientific results. But in reducing false positives, the proposed new p-value will lead to more false negatives, where the signal is mistaken for noise. False negatives are problematic because no one wants to report negative data. Does the National Need to Eat Kale Association want to say that kale does not affect heart health? No. So they file the paper away, leaving the data unpublished – the ‘file-drawer’ dilemma. The scientists who champion the p-value change recognize these difficulties. To reduce the filing away of negative data registries listing all studies undertaken would prevent studies from disappearing from view. To reduce false negative they recommend that the size of the groups be increased by 70%, but that requires more time to recruit participants and increases costs. In the journal driven world of scientific publication, increased time and expense are real buzzkills. Sample size can be increased using ‘big data,’ large datasets frequently collected by government agencies (thus lowering research costs). The number of these type of studies is rapidly proliferating. The problem here is that some authors act as explorers searching the data sets for statistically significant findings they can report. It is reminiscent of the exploration of Africa by Europeans who busily renamed every feature and squirreled away every resource. Exploration is important, but the scientific method requires a theory to predicts outcomes subsequently verified through observation. Exploration simple reports observation, underlying theories, and mechanisms are then tortured to fit the data.
Responding to the initial recommendation to reduce the p-value threshold, other scientists have suggested that any one-size fits all p-value even if reduced is still problematic. The context of the hypothesis should also be considered. Do we need as stringent a p-value threshold to verify that the sunlight is as good for you as kale? You can see the relativity of standards that would introduce, after all, kale is good and to be truthful the sun has been associated with an increased incidence of skin cancers. Moreover, critics of a change in p-value thresholds say that the change keeps the community fixated on p-values rather than considering other approaches. These other methods [3] include:
- Concentrating on effect sizes (how big of a difference does an intervention make, and is it practically meaningful?)
- Confidence intervals (what’s the range of doubt built into any given answer?)
- Whether a result is novel study or a replication (put some more weight into a theory many labs have looked into)
- Whether a study’s design was preregistered (so that authors can’t manipulate their results post-test), and that the underlying data is freely accessible (so anyone can check the math)
- There are also new, advanced statistical techniques — like Bayesian analysis — that, in some ways, more directly evaluate a study’s outcome
Statisticians' national voice, the American Statistical Association, has offered six principles in understanding the role of p-values. Let me summarize (italics added)
- P-values can indicate how incompatible the data are with a specified statistical model. … This incompatibility can be interpreted as casting doubt on or providing evidence against the null hypothesis or the underlying assumptions.
- P-values do not measure the probability that the studied hypothesis is true, or the probability that the data were produced by random chance alone. It is a statement about data in relation to a specified hypothetical explanation, and is not a statement about the explanation itself.
- Scientific conclusions and business or policy decisions should not be based only on whether a p-value passes a specific threshold. Practices that reduce data analysis or scientific inference to mechanical “bright-line” rules (such as “p < 0.05”) for justifying scientific claims or conclusions can lead to erroneous beliefs and poor decision making. A conclusion does not immediately become “true” on one side of the divide and “false” on the other. Researchers should bring many contextual factors into play
- Proper inference requires full reporting and transparency. Valid scientific conclusions based on p-values and related statistics cannot be drawn without at least knowing how many and which analyses were conducted, and how those analyses (including p-values) were selected for reporting.
- A p-value or statistical significance does not measure the size of an effect or the importance of a result. Statistical significance is not equivalent to scientific, human, or economic significance.
- By itself, a p-value does not provide a good measure of evidence regarding a model or hypothesis. Researchers should recognize that a p-value without context or other evidence provides limited information
For most of us, this is a debate in which we cannot participate, but that should not mean that we do not have a stake in the outcome or that what our scientists decide will not have consequences for us all. It is important how the persons we have entrusted with our search for knowledge choose to act.
[1] Fictitious, but you knew that, right?
[2] http://www.nature.com/news/one-size-fits-all-threshold-for-p-values-under-fire-1.22625
[3] https://www.vox.com/science-and-health/2017/7/31/16021654/p-values-stati...

Chuck Dinerstein, MD, MBA
Director of Medicine
Dr. Charles Dinerstein, M.D., MBA, FACS is Director of Medicine at the American Council on Science and Health. He has over 25 years of experience as a vascular surgeon.


