
What does it cost to have a chronic illness?
You would think that with all the discussion and policy debate about healthcare costs it would be relatively simple to determine whether it's more expensive to have heart disease or diabetes. And of course, if you thought that you'd be wrong.
Most of our economic data are aggregated and we often lose sight of the tree for the forest. A new paper in PLOS Medicine sheds some light on the trees.
It is difficult to separate diseases in clinical practice. Physicians whose hospital notations determine billing are often asked whether the cause of this or that problem is due to one or another condition. One example of this is an open sore on a patient, due either to their diabetes or their vascular disease. The truth is that it's a little of both, but physicians have to choose the significant cause.
The researchers used statistical methods to separate diseases using data from New Zealand, where 82% of healthcare is publicly financed and an individual’s expenditures can be followed over time. They looked at patient expenses for the "six horsemen of the apocalypse," the major non-communicable diseases that represented 59% of all spending:
- cancer
- cardiovascular disease
- diabetes
- musculoskeletal problems
- neurologic diseases
- chronic lung, liver and kidney disease (taken as an aggregate)
The researchers make two observations that provide a better understanding of spending by individuals, e.g., those trees in the forest.
Healthcare spending has a temporal pattern
Much is made in the literature, as well as the popular press, about how much we spend on an individual's last year of life, which I’ve written about this in the past. One of the difficulties is that it is so difficult to say when someone will die.
But that aside, when we separate the initial diagnostic and treatment expenses from the intervening years when the disease is chronic, some distinct patterns emerge. I have summarized the increased annual costs for men aged 60-64 from the baseline expenditure of $556 for a male without any medical problems, while separating the year of diagnosis, the years of chronicity and the year of death. The pattern is the same for both gender and age groups [1] although the actual expenses vary.
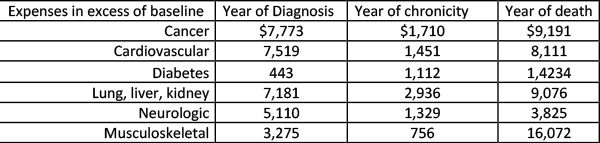
The last-year-of-life expenses remain high, but look at how much it costs to diagnose, stabilize and treat a patient initially; for the most part, those costs are in the same ballpark. And more importantly, consider the cost of an illness's chronicity. The more diseases that we convert from lethal into chronic, and the longer we can keep those people comfortable, the greater our expenditure.
Today people survive cancer and live with diabetes or cardiovascular disease –– and that costs money. The next time you hear about how much of our GDP is going to healthcare, remember that a large portion of that is for chronic care. Or in other words, we keep our citizens alive and at their best for a long time. For those cynics among us, the cost of treating a single disease was less for the elderly than younger or mid-life patients. Could it be that we tried less to treat these patients, or is it the length of chronicity that makes the difference?
1+1 is more than 2 when more than one disease is present
Most studies look at a specific condition and consider any accompanying illness a co-morbidity or risk factor. Diabetes and cardiovascular disease are frequent traveling companions and diabetes is frequently treated as the co-morbidity. It turns out that when looking at combinations of diseases, the resultant expenses are more than simply summing the costs; there's a synergy between the two that increases costs.
The researchers estimate that 23.8% of healthcare spending from the non-communicable diseases (NCD) was due to this super-additive effect. Here's another table summarizing their findings, looking at the excess cost for men for the various combinations of the non-communicable diseases:
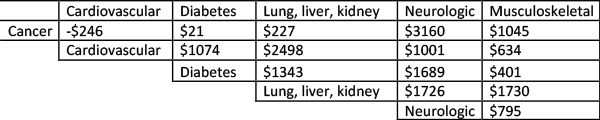
While the specific super-additive costs vary, the trend is the same for both gender and age groups. Super-additive costs were more significant for those that were younger [1], echoing the fact that they lived longer and rang up those yearly expenditures to “live with" their diseases.
The "why" of the differences is unknown, but here there's room for conjecture.
First is the outlier, having cancer and cardiovascular disease result in savings. Could this reflect the idea that in the presence of cancer we are a little less consciously aggressive in treating a patient’s cardiovascular disease? Do we try harder for the younger patients, and is that why their expenses are greater than those in the older age groups? Even more interesting: How musculoskeletal and neurologic conditions were the big drivers of excess cost.
The presence of either, or both, neurologic and musculoskeletal diseases, along with one other illness, explains 84% of the excess cost. Why would that be? Perhaps because those illnesses are more frequently chronic and not life-threatening. They do not kill, they disable. Our health system is designed to care for the disabled as well as the acutely ill and those who are dying.
Very, very frequently a discussion of health care economics leaves the daily expense of chronic care, especially for the disabled, unconsidered. The increased excess cost for neurologic and musculoskeletal diseases for the elderly may stem from their disabilities requiring greater support. For example, when you're wheelchair bound, it costs more to get to your doctor’s appointment.
The study is limited in some ways. The baseline expenses were imputed from the aggregate of patients who are well, and they are not exact. The New Zealand health system does not cover about 20% of the type of care patients can receive, and those out-of-pocket expenses are not recorded in the data sets. And supportive care, like rehabilitation and skilled nursing facilities, are not included. So this observational study demonstrates trends but is not precise.
[1] Young 45-49, Mid-life 60-64, and Old 75-79
Source: Health system costs for individual and comorbid noncommunicable diseases: An analysis of publicly funded health events from New Zealand PLOS Medicine DOI: 10.1371/journal.pmed.1002716

Chuck Dinerstein, MD, MBA
Director of Medicine
Dr. Charles Dinerstein, M.D., MBA, FACS is Director of Medicine at the American Council on Science and Health. He has over 25 years of experience as a vascular surgeon.


