
The study reported in The Journal Of Bone And Joint Surgery was based on prior work suggesting that beta blockers, a medicine used for treating hypertension and other cardiovascular diseases, may lessen inflammation and, therefore, slow the progression of osteoarthritis. The data supporting this hypothesis is uncertain, with some studies suggesting beta blockers downregulate inflammatory factors influencing the degeneration of cartilage and others showing no impact.
From the point of view of the current research, the question was simply whether the use of a beta blocker influences the course of osteoarthritis to the degree that it lowers the need for knee replacement. They found in their comparison of 300 patients undergoing knee replacement with 300 age, gender, and osteoarthritis severity-matched controls that using beta blockers for prolonged periods, roughly five years, was associated with a 64% reduction in the odds of needing surgery. Here is their causal map.
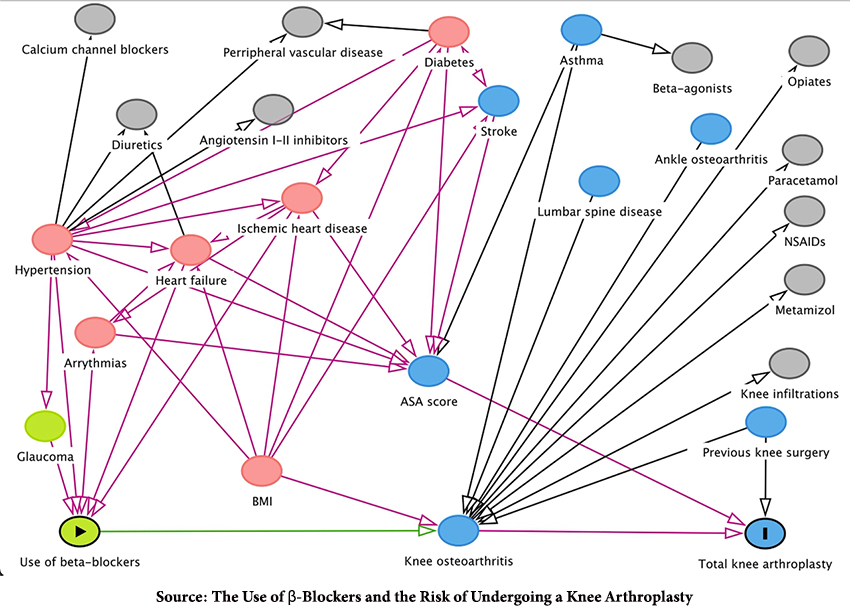
There, along the bottom, is the causal pathway under study, the impact of beta blockers, the exposure variable on knee arthritis and subsequent surgery, the outcome variable. But the path is not straight; a range of mediators, intermediate variables, can and do affect the causal chain.
- Those circles in blue are called ancestor outcomes, variables that precede or are causally related to the outcome of interest. In this instance, the severity of osteoarthritis in the individual is impacted by lumbar spine disease, ankle osteoarthritis, and prior knee surgery. The ASA score, a subjective assessment by the anesthesiologist of operative risk, will affect the likelihood of surgical treatment (A higher ASA frequently means that operative risk outweighs surgical intervention).
- Those pink circles refer to ancestor outcomes and exposures, in this instance, co-morbidities, like diabetes, cardiovascular disease, and weight, that influence the prescription of beta blockers and, in turn, the ASA score. Note BMI, which, despite being considered a “flawed” measure, impacts all of the co-morbidities (and not in a good way) and separately impacts the severity of osteoarthritis of the knee. It is more difficult for a knee, diseased or well, to carry 300 pounds around.
- Those gray circles are other variables. The use of opiates, non-steroidal anti-inflammatory drugs (NSAIDs), Paracetamol (acetaminophen), and knee injections are all influenced by the severity of knee osteoarthritis and, in turn, may help or fail to reduce the disease progression.
- The red lines signify pathways that will bias the use of beta blockers, the severity of osteoarthritis, and the outcome. The black lines illustrate other pathways. Only the green line represents the hypothesized causal pathway.
All of these variables need to be “controlled” in the analysis. All of the interactions between and among the variables are non-linear, meaning that hypertension does not always result in ischemic heart disease, and the correlation between the two is not a straight line. The diagram illustrates the many non-linear interactions across a host of variables. This is the definition of a chaotic system.
Biology is chaotic
Chaotic systems are susceptible to their initial conditions; in this study, the researchers created categories to describe how long an individual was taking a beta blocker – this was an attempt to control the initial conditions and simplify the outcomes. Chaotic systems are not proportional; in this instance, not every individual with a beta blocker and osteoarthritis went on to surgery. One of the most significant factors influencing that outcome that could not be controlled was the subjective assessment by the anesthesiologist of the operative risk, the ASA score. Most importantly, chaotic systems are very difficult to use in making predictions; our most accurate predictions of chaotic systems are the weather reports. All of these factors influence the certainty of researchers’ conclusions.
This is a relatively simple causal map. I found it helpful in providing a context for the research discussion. We would all benefit from seeing more of these causal maps in studies. To me, this is an excellent example of how “a picture is worth a thousand words” and perhaps a few p-values.
Source: The Use of b-Blockers and the Risk of Undergoing a Knee Arthroplasty, Journal Of Bone And Joint Surgery DOI: 10.2106/JBJS.22.01189

Chuck Dinerstein, MD, MBA
Director of Medicine
Dr. Charles Dinerstein, M.D., MBA, FACS is Director of Medicine at the American Council on Science and Health. He has over 25 years of experience as a vascular surgeon.


