PM2.5 is also known as “fine” (as opposed to coarse) particles, and sometimes as “soot” (a misnomer used by the New York Times). Roughly 1900 health-related scientific papers including “PM2.5” in abstract or title have been published.
Air pollution comes in the three states of matter.
Gaseous: specific molecules emitted directly (CO, SO2, NO, H2S, CH2O [formaldehyde]) or formed in the atmosphere from other pollutants (NO2, O3), among others.
Liquid: C6H6 [benzene], fog droplets containing other pollutants.
Solid: various airborne particles small enough to be inhaled, including smoke, combustion products, and pollen.
The gases and liquids have specific chemistry that facilitates atmospheric monitoring, but solids, particulate matter (PM) contains many substances. “Soot” refers to elemental or black carbon (EC), but in general airborne particles are regulated by size range without regard to chemical composition, except for airborne lead. Each has been shown to be toxic at some level, and some selected for regulation by the EPA in 1970. Air pollution is regulated by identifying pollutants known to be harmful, determining “safe” concentration levels, measuring current outdoor exposures, and estimating the reductions in source emissions required to achieve those safe levels throughout the nation.
Descriptions of Particles
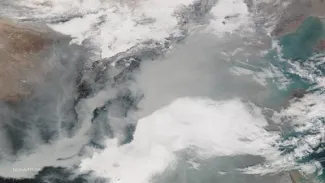
Airborne particles have a long history of concern, from smoke to grit. Perhaps the first paper (1913) on air pollution and health compared the amounts of soot collected on horizontal plates at various locations in Pittsburgh with respect to their association with mortality rates from pneumonia and tuberculosis. Soot remained a focus of air pollution control in major cities for decades, especially New York, where studies showed strong associations between daily levels of black smoke and mortality. London suffered 4000 “excess” deaths during an episode of extremely smoky fog in 1952, an event credited with initiating the modern air pollution control movement.
Size is the main metric for characterizing airborne particles, based on “aerodynamic diameter” that takes both size and density into account and is generally expressed in microns, μm (millionth of a meter and smaller than a human hair). Total suspended particulates (TSP) are < 50 μm, “inhalable” PM, < 10 μ, and “fine” PM, < 2.5 μm. Ultrafine particles (UFP) are smaller than about 0.1 μm and include even smaller “nanoparticles” for which atmospheric concentrations are measured as numbers of particles rather than mass. Since particle mass increases with the cube of the diameter, a PM10 particle may weigh 64 times more than a PM2.5 particle and be the equivalent of a billion UFPs. Particles are by far the most heterogeneous of the regulated air pollutants. The air collected by an air pollution monitoring device is only a sample of what we actually breathe.
In the 1950s, the U.S. began a national air sampling program for TSP that involved drawing ambient air through a filter and weighing the collected material. The initial motivation was to check for radioactive fallout from previous testing of nuclear weapons; the network also collected data on a wide range of particulate inorganic and elemental constituents. Soot was measured initially by the degree of blackness in filter deposits and now by chemical analysis. In 1979, EPA commissioned a national network of size-selective PM samplers that extracted fine, coarse, and inhalable particles. These data were not incorporated into the EPA regulatory database and were largely neglected by epidemiologists but have subsequently been used in various human health studies. The literature on PM2.5 health effects began in 1981, stating concerns that such particles could impact the lower lung and surrounding tissue. EPA’s routine nationwide sampling of ambient concentrations started in 1999.
The distinction of “inhalability” comes from studies of respiratory dynamics in which larger particles are deposited in the nose and throat, slightly smaller ones in the upper respiratory tract, and PM2.5 in the lower alveolar respiratory tract. UFPs can readily deposit in the alveoli and translocate to the bloodstream. However, the detailed behavior of inhaled particles is considerably more complex and involves both deposition and clearance processes. Tissue samples of autopsied lungs from Mexico City showed aggregated carbonaceous particle masses (EC) that are rarely seen in the lungs from “clean” cities. Most of the particles were < 0.25 μm, soluble particles such as the sulfate content of PM were not seen, and smaller particles would have been difficult to enumerate.
Sources and Distributions of Ambient PM2.5
Figure 1 displays typical particle size ranges from various emission sources together with ranges of the common measurement metrics; 2.5 and 10 μm are median, not maximum values of aerodynamic diameters. The three smallest size ranges, ultrafine, PM2.5, and PM10, encompass both a wide range of chemical composition and emission sources. For example, a PM2.5 sample collected in a large northeastern city might be dominated by oil smoke, fly ash, and H2SO4 mist, while various types of dust might dominate one from the southwest. Indoor PM2.5 samples likely include environmental tobacco smoke, black (elemental) carbon, and various organic compounds. This diversity makes it difficult to devise effective national emission control strategies as required by the Clean Air Act.
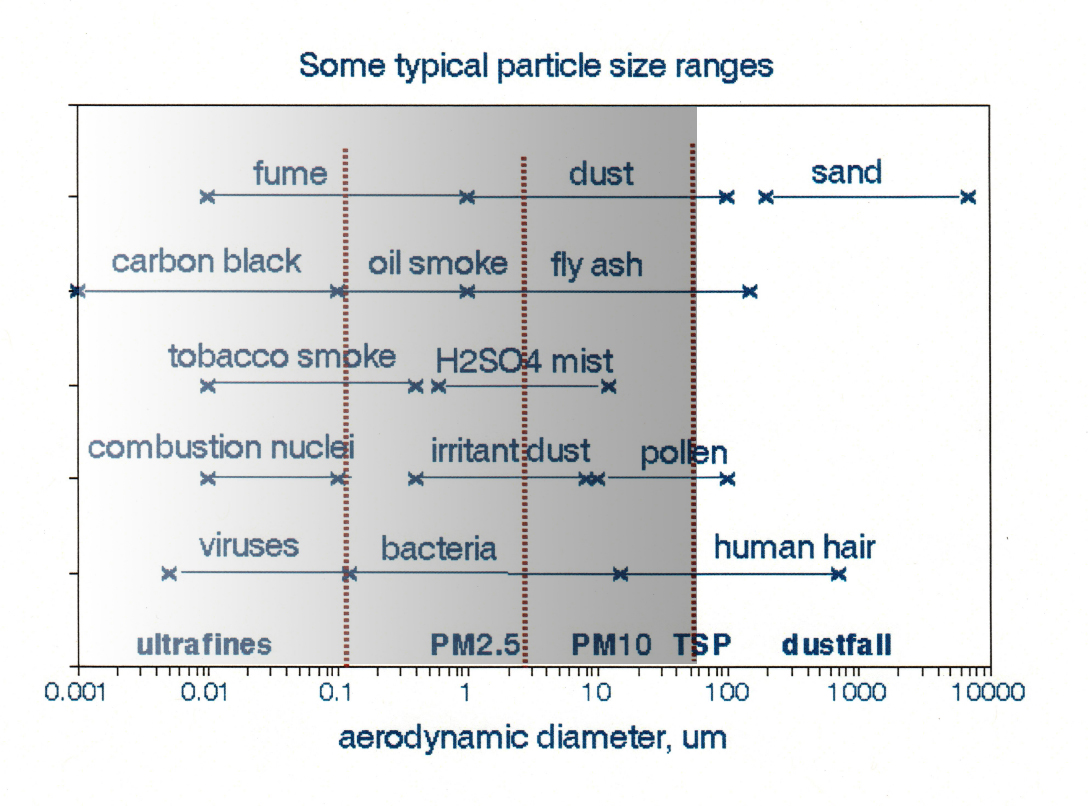
Figure 1. Size ranges of particles from various sources. Adapted from Foster [1]
The US EPA maintains databases on national emissions of regulated air pollutants and the corresponding ambient air quality concentrations. Emissions are listed by type of source; for example, power plants are by far the largest source of sulfur dioxide (SO2), about 70%. The situation is much less clear for PM2.5. 35% comes from 12 defined source types are listed, while 65% of emissions are described as “miscellaneous.” Miscellaneous sources comprised 85% of the PM10 emissions.
I extracted annual emissions and air quality data from 1980 to 2018 for PM2.5, PM10, and SO2. As you might expect, trends in emission and air quality were highly correlated (R=~0.98). The PM2.5 data began in 1990, PM10 from 1980, and SO2 from 1970. I found that national average ambient PM2.5 concentrations were highly correlated with the corresponding SO2 levels, as shown in Figure 2, and that this trend also predicts the 1980 data. I interpreted this relationship as identifying the SO4 content of PM2.5, which declined linearly as SO2 emissions were controlled. The y-intercept of the graph (6.8 μg/m3) thus represents the non-sulfate constituents of PM2.5 emitted by the 12 specific source types and comprising about one-third of the total.
While controlling SO2 from power plants was relatively straightforward, i.e., the “low-hanging fruit,” controlling these other sources would be more difficult. PM10 emissions are roughly four times greater than PM2.5 emissions, while ambient concentrations only double. PM10 is only moderately correlated with SO2, and it seems clear that the PM2.5 and PM10 datasets are inconsistent even though PM2.5 is a subset of PM10 by definition.
Dispersion and interactions of PM in the atmosphere also depend on particle size and composition. The resulting heterogeneity complicates their utility as predictors of health effects. PM samples may include elements of the periodic table as well as inorganic salts like (NH4)2SO4 and NH4NO3. These compounds are of particular interest because they are formed in the atmosphere from (regulated) SO2 and NO2 emissions. These secondary pollutants are monitored less thoroughly and make epidemiological cause and effect relationships less reliable; mathematical modeling may provide more detail.
Figure 2. Trend data for PM2.5 and SO2 showing sulfate and non-sulfate constituents.
A previous project used emissions data and an atmospheric dispersion model to predict ambient concentrations of SO4, EC, SO2, and NOx (NO+NO2) for each county in the contiguous United States. SO4 and EC are important constituents of PM2.5, especially SO4, which can account for most of the mass. I found that SO4 is by far the most spatially uniform; EC is a much smaller constituent and tends to remain locally distributed.
Health Effects
Hundreds of epidemiology studies of PM2.5 have been published in large part because of regulatory concerns and the assumption of causality. Only a few studies compared associations with health effects by PM size; I compare three of them in Figure 3, in which the daily mortality effects are shown as curve-fits. The most thorough study comprised time-series analyses of daily mortality in Philadelphia in which 47 different measures of PM, including nearby locations, were evaluated, from 1 μm SO4 particles to 50 μm TSP. Associations were compared based on mean concentrations, i.e., the reduction in mortality following total elimination of the pollutant. These data indicate a slight positive relationship between particle size and mortality risk.
The next dataset was collected daily in Erfurt, Germany. It included PM2.5, PM10, and three different measures of UFPs, which showed the strongest effects with no effect of particle size within that range. PM2.5 and PM10 had weaker effects, with no significant differences between them. The third data set comprised annual cross-sectional relationships among 151 U.S. metropolitan areas for which the effect was negative with wide confidence limits, presumably because of the difficulty of controlling for the many potentially confounding variables in long-term spatial analyses. In the Harvard Six Cities Study (not shown), where the PM2.5 fit the data best, TSP, PM2.5, and SO4 had essentially the same mean effects. All told, Figure 3 does not support a special mortality relationship with PM2.5. It shows consistent excess mortality risks of 5-6% across a wide variety of PM measures with no indication of specificity, providing no guidance as to which emission sources should be controlled to benefit public health.
The short-term (daily) mortality risks shown in Figure 3 are more consistent than the long-term (spatial) risks if independent of particle size. All of them fluctuate with the weather and primarily affect the frail elderly rather than initiating new cases of chronic diseases. It is possible that different individuals within such at-risk subgroups could be sensitive to a range of air quality excursions. Air pollution has also been associated with morbidity effects such as hospitalization, lung function, and heart attacks. My review of about 400 such long-term studies [2] found no differences among them in the fractions of significant findings for TSP, PM2.5, or PM10.
It’s essential to recognize that with each breath, we inhale all of the pollutants present, every PM constituent, and size. I can think of no situation in which one’s breath is limited to a single type of particle. Thus, even though a sample may be labeled “PM2.5,” there may have been health effects from any of the various pollutants and other types of particles inhaled. There is much less ambiguity with molecules like CO, O3, or SO2.
Given the insensitivity to particle size, what is special about PM2.5?
- EPA selected PM2.5 for regulation, nationwide monitoring, and special attention giving rise to funding epidemiological studies focused on particle mass rather than the toxicity of constituents.
- Ambient PM2.5 concentrations declined by about 60% since 1980, mainly from reducing power plant SO2 emissions.
- PM2.5 is now primarily emitted by many different types of sources, complicating further improvements.
- Spatial distributions of PM2.5 tend to be more uniform than other pollutants leading to more precise exposure estimates that may make risk estimates more precise (but not necessarily valid).
Figure 3. Comparison of PM associations with all-cause mortality by median particle diameter.
Sources:
[1] Foster W.M. Deposition and Clearance of Inhaled Particles. In Air Pollution and Health, ed. By Holgate ST, Samet JM, Koren HS, Maynard RL. Academic Press, London. 1999 pp. 295-324.
[2] Lipfert FW. Long-term associations of morbidity with air pollution: A catalog and synthesis. J Air Waste Manag Assoc. 2018 Jan;68(1):12-28. DOI: 10.1080/10962247.2017.1349010.


