
More specifically, the researchers looked at two states within southern India with the where-with-all in terms of healthcare workers and spending to mount an aggressive surveillance program – testing all that sought care for respiratory or flu-like symptoms, creating containment zones of 5 km around homes for daily surveillance for individuals with new symptoms, and daily follow-up of the contacts of confirmed cases 5-14 days after their contact.
From a dataset of over 3 million known exposed contacts, the researchers looked at 575,000 contacts with sufficient demographic and laboratory information after exposure to 85,000 confirmed, “index” cases. [1] The confirmed cases were slightly younger and female than the general population in these states, suggesting that the contact tracing identified less severe cases.
![]()
- The mean number of contacts per index case was 7.3. The graph (note the log scale!) depicts the declining contact number.
- 70.7% of index cases had no positive contacts, but index cases with a positive contact had nearly twice as many contacts to evaluate – superspreaders do exist.
Contact tracing assumes that the index case was responsible for the contact’s infection. Taking that assumption as true, the researchers calculated the rate of transmission from index to contact. Here is what they found:
- Without protective measures, 10.7% of high-risk individuals were infected, 4.7% of low-risk individuals
- Gender seemed to play no role in the transmission
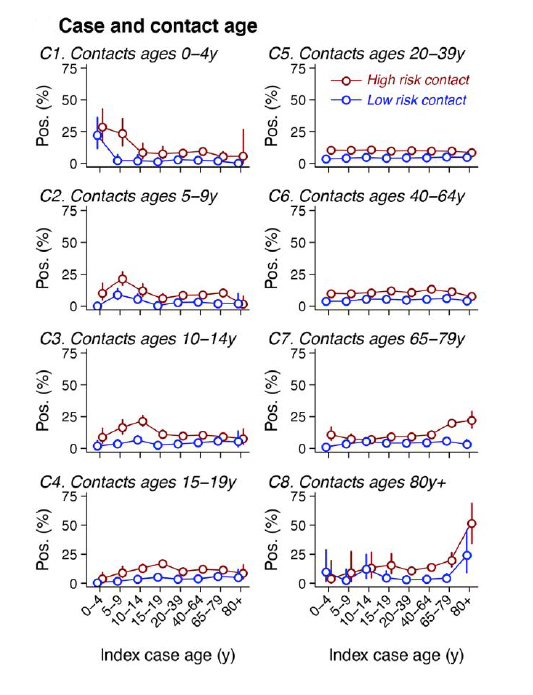
- Age was a factor. Most positive contacts in any age group were exposed to a 20 to 44-year-old index case. That said, in the case of the very young and old, most index cases were of similar age.
- The location of the contact also seemed to matter. Transmission was lowest in healthcare settings at 1.2%, rising to 2.6% within the community and 9% in households – consistent with perceived transmission here in the US
Mortality statistics came from a subgroup of the larger study population.
- Overall, case fatality was 2.06% [2]. The mortality followed what we have come to expect, worse in men, increasing with age, and with co-morbidities.
- Time from identification to death was only six days compared to a median of 13 in the US, suggesting these cases were identified late in the disease’s course.
Finally, there is this chart, which shows the mortality across age groups.
![]()
Andhra Pradesh and Tamil Nadu refer to the two Indian states
There is a difference in which age group has the most significant mortality, with the peak in the 50-64-year-old Indians and the US peak in its 85+ age group. The researchers suggest that it may be due to social distancing and stay-at-home orders for older Indians, or that the life expectancy of Indians of 69 makes the older one more resilient. I know that US seniors, me amongst them, are being more cautious than our younger brethren. But I think that the other factor at play is that the US healthcare system is far better at keeping the frail and less resilient alive for far longer and that COVID-19 is culling our most susceptible.
[1] The study has limitations, especially since only 20% of the positive cases came to be reviewed in this paper. More importantly, there is little temporal data to fix the exposure to a timeline.
[2] It is hard to provide a US comparative statistic. According to the CDC’s most current report, the mortality is 6.3%, but that includes pneumonia and influenza as well as COVID-19
Source: Epidemiology and transmission dynamics of COVID-19 in two Indian states Science DOI: 10.1126/science.abd7672 (2020).

Chuck Dinerstein, MD, MBA
Director of Medicine
Dr. Charles Dinerstein, M.D., MBA, FACS is Director of Medicine at the American Council on Science and Health. He has over 25 years of experience as a vascular surgeon.


