The data set continues to be drawn from Our World in Data and is based on CDC statistics for the US.
Global
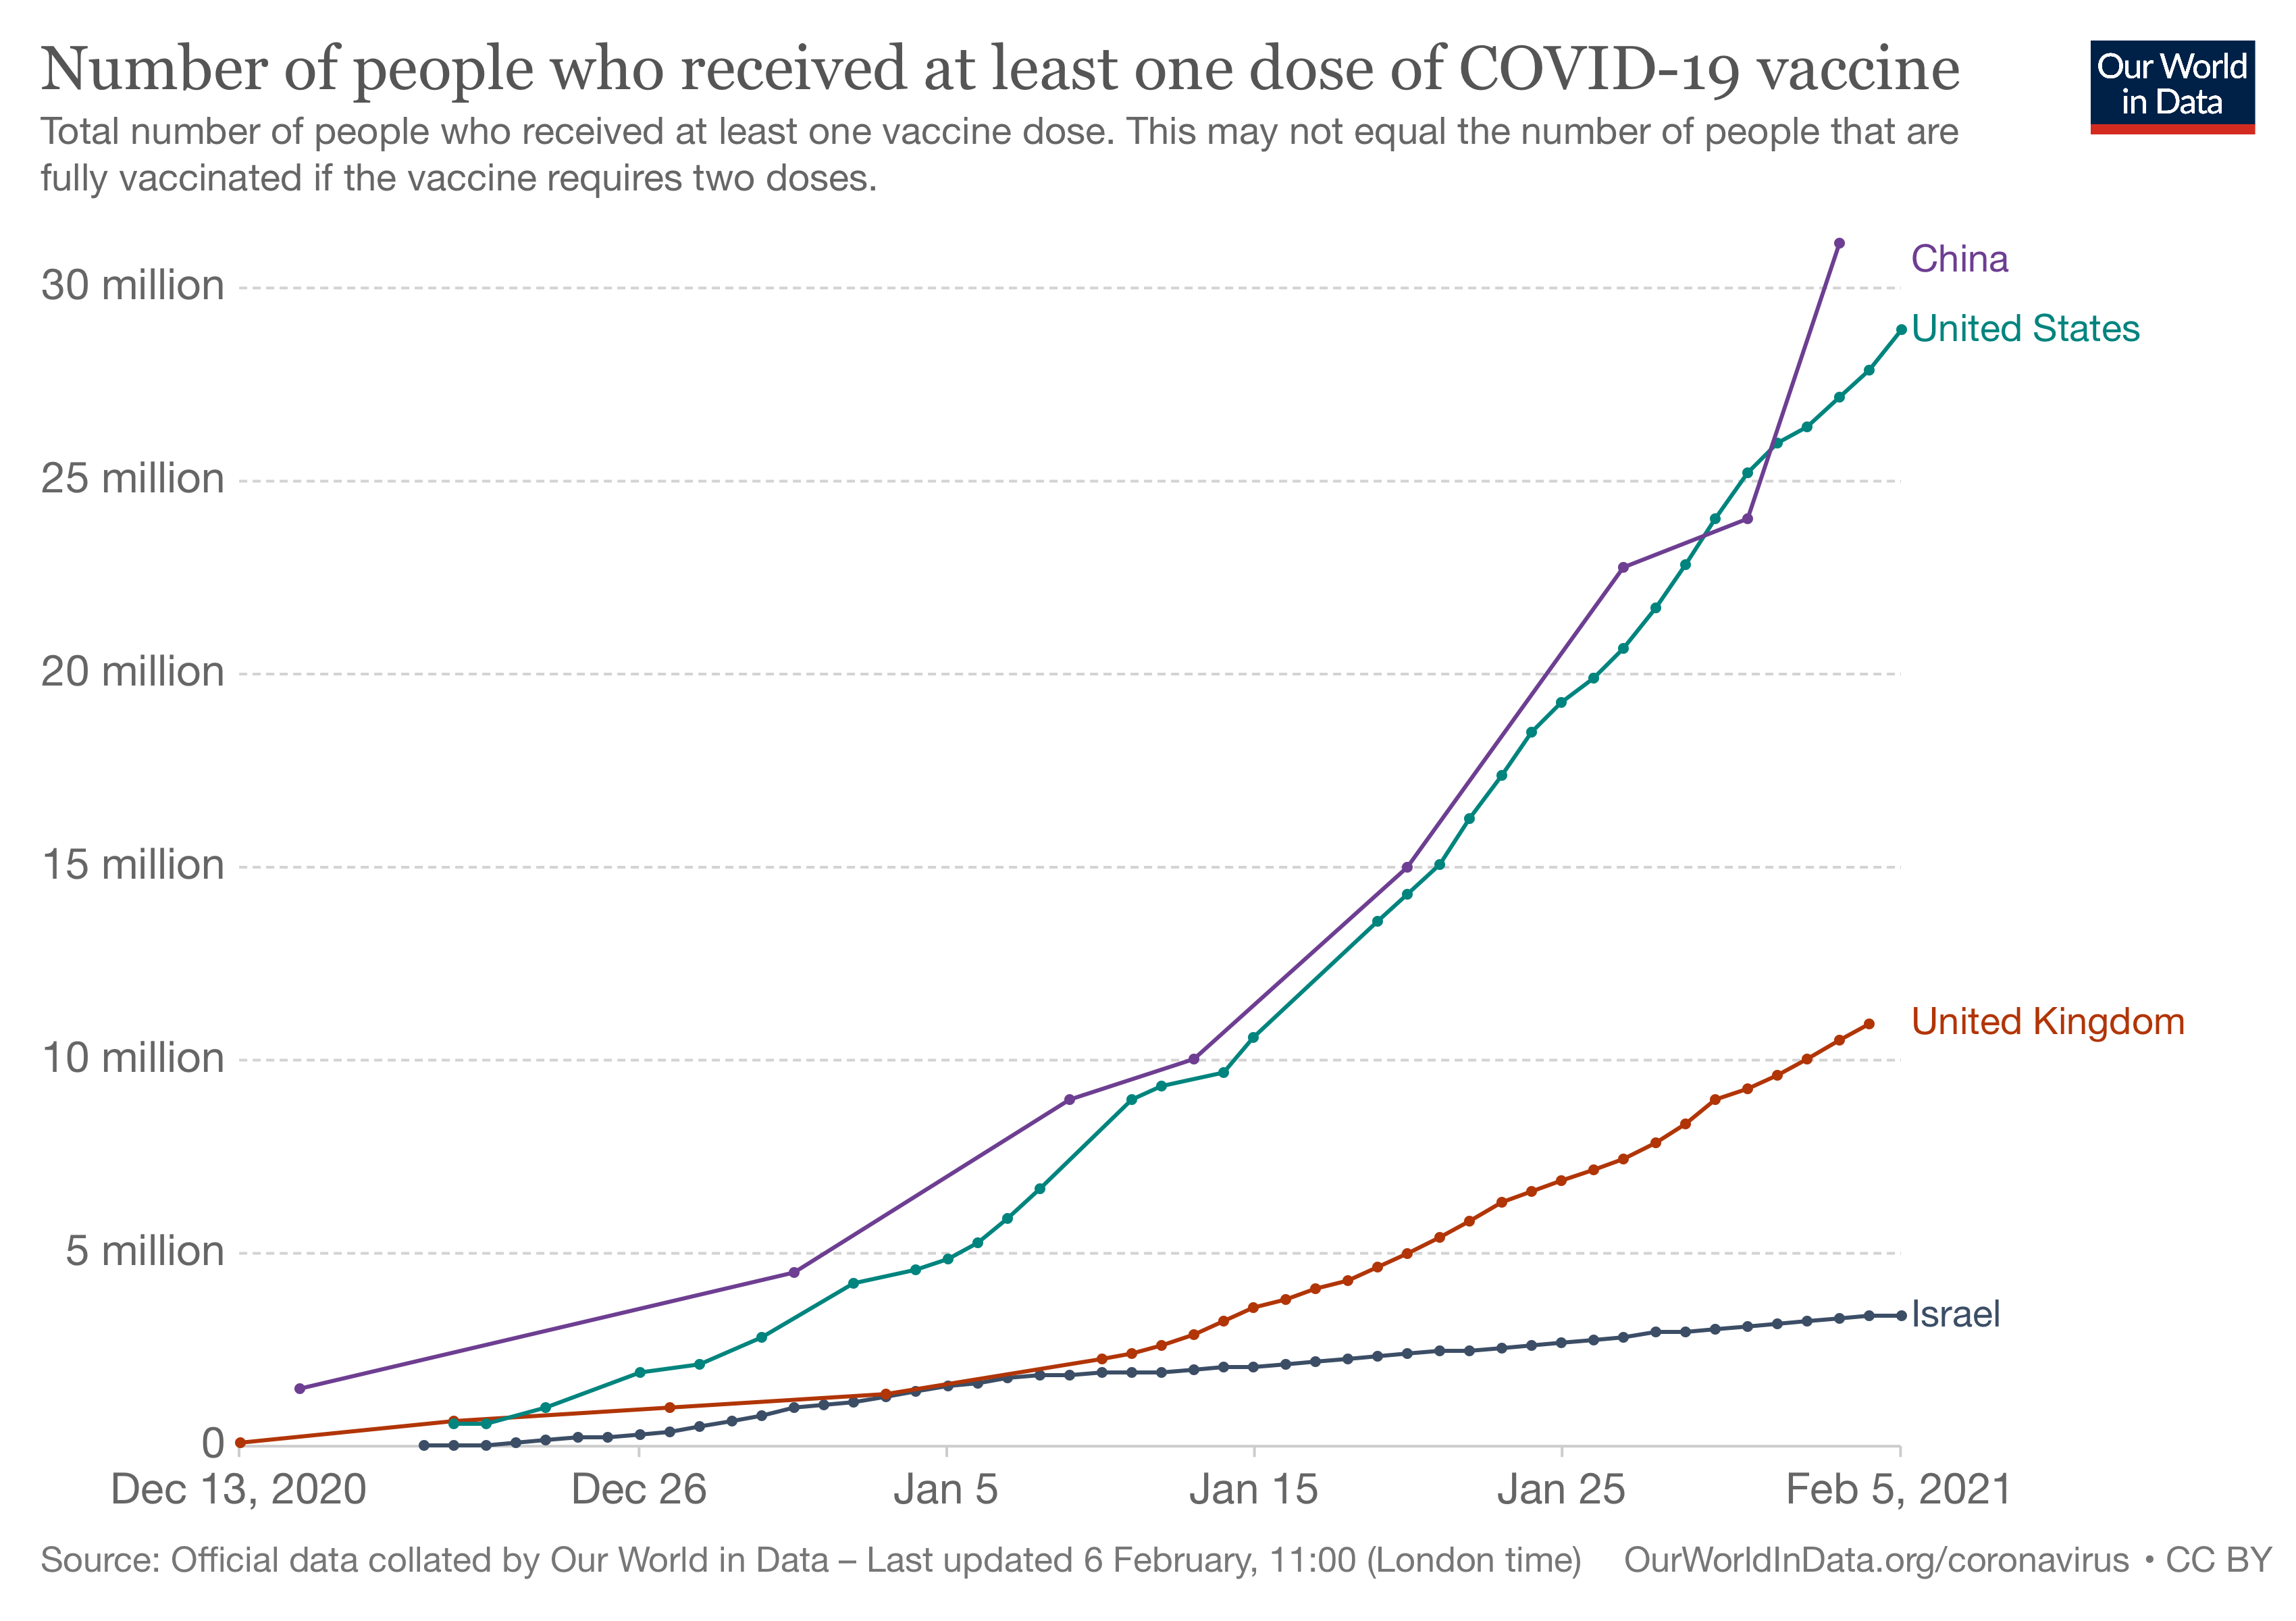
Quick update, the US pace has picked up. We still have delivered the most doses, almost 37 million, and overall, we have administered at least one vaccination dose to 11% of the population, a 30% increase from last week. Israel continues to lead the pack at 60%, with little change in China, Russia, or India. Globally we have given out a little over a vaccine dose to 2% of the Earth’s population. I chose this graph to give you a sense of the global increase in daily doses.
On to the US- Herd immunity
In short, still a distant goal. Here are the stats on the fully immunized.
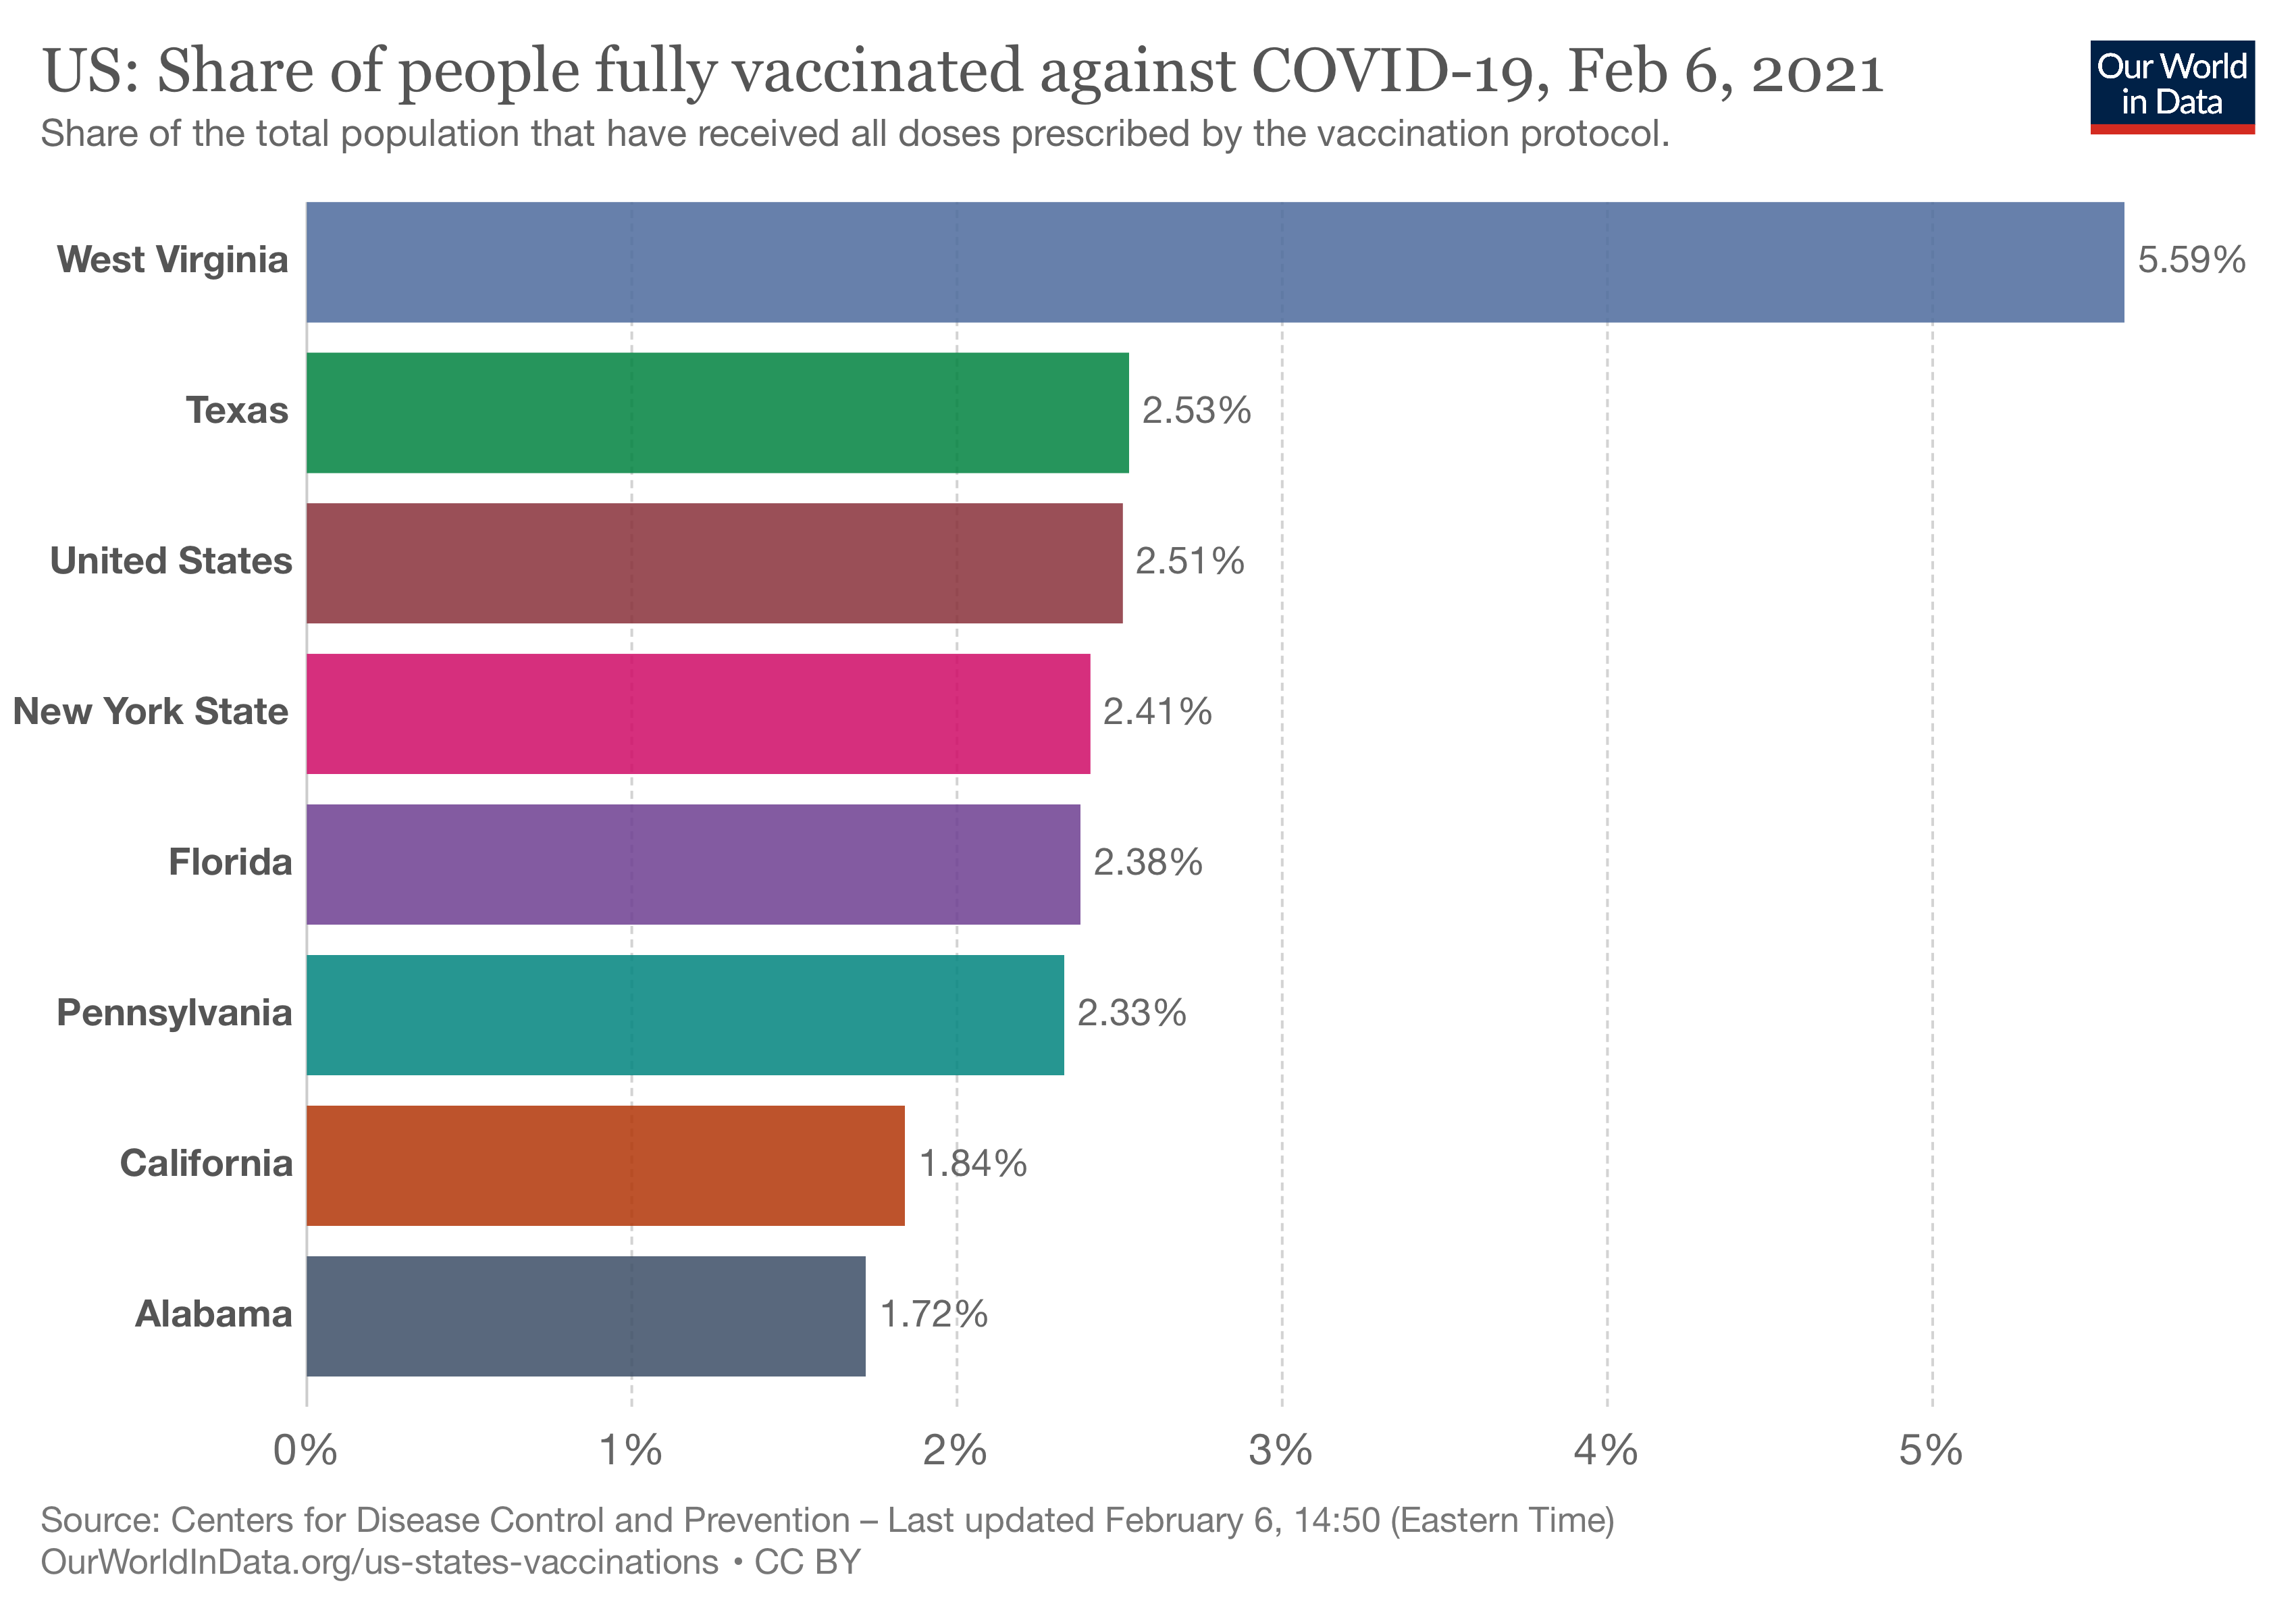
Everyone improved by a percentage point; describing the changes adds little to the big picture. At this current rate, for a herd immunity at 80%, we need another 17 months. If we continue to increase our vaccinations by the same 1% over the previous week, we might see herd immunity in 3 to 6 months.
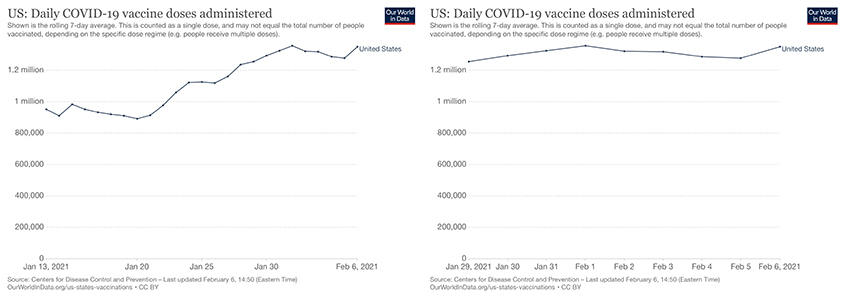
The graph on the left shows the increasing doses administered since January 13th, and the rise looks impressive - and it has been helpful. But in the last week, the graph on the right, suggests the increase in doses is relatively flat.
Vaccine Operations
Overall, we are giving 1.35 million doses a day. For the politically inclined, President Biden's promise to increase doses to over a million a day was easy to achieve. The numbers need to be much more significant.
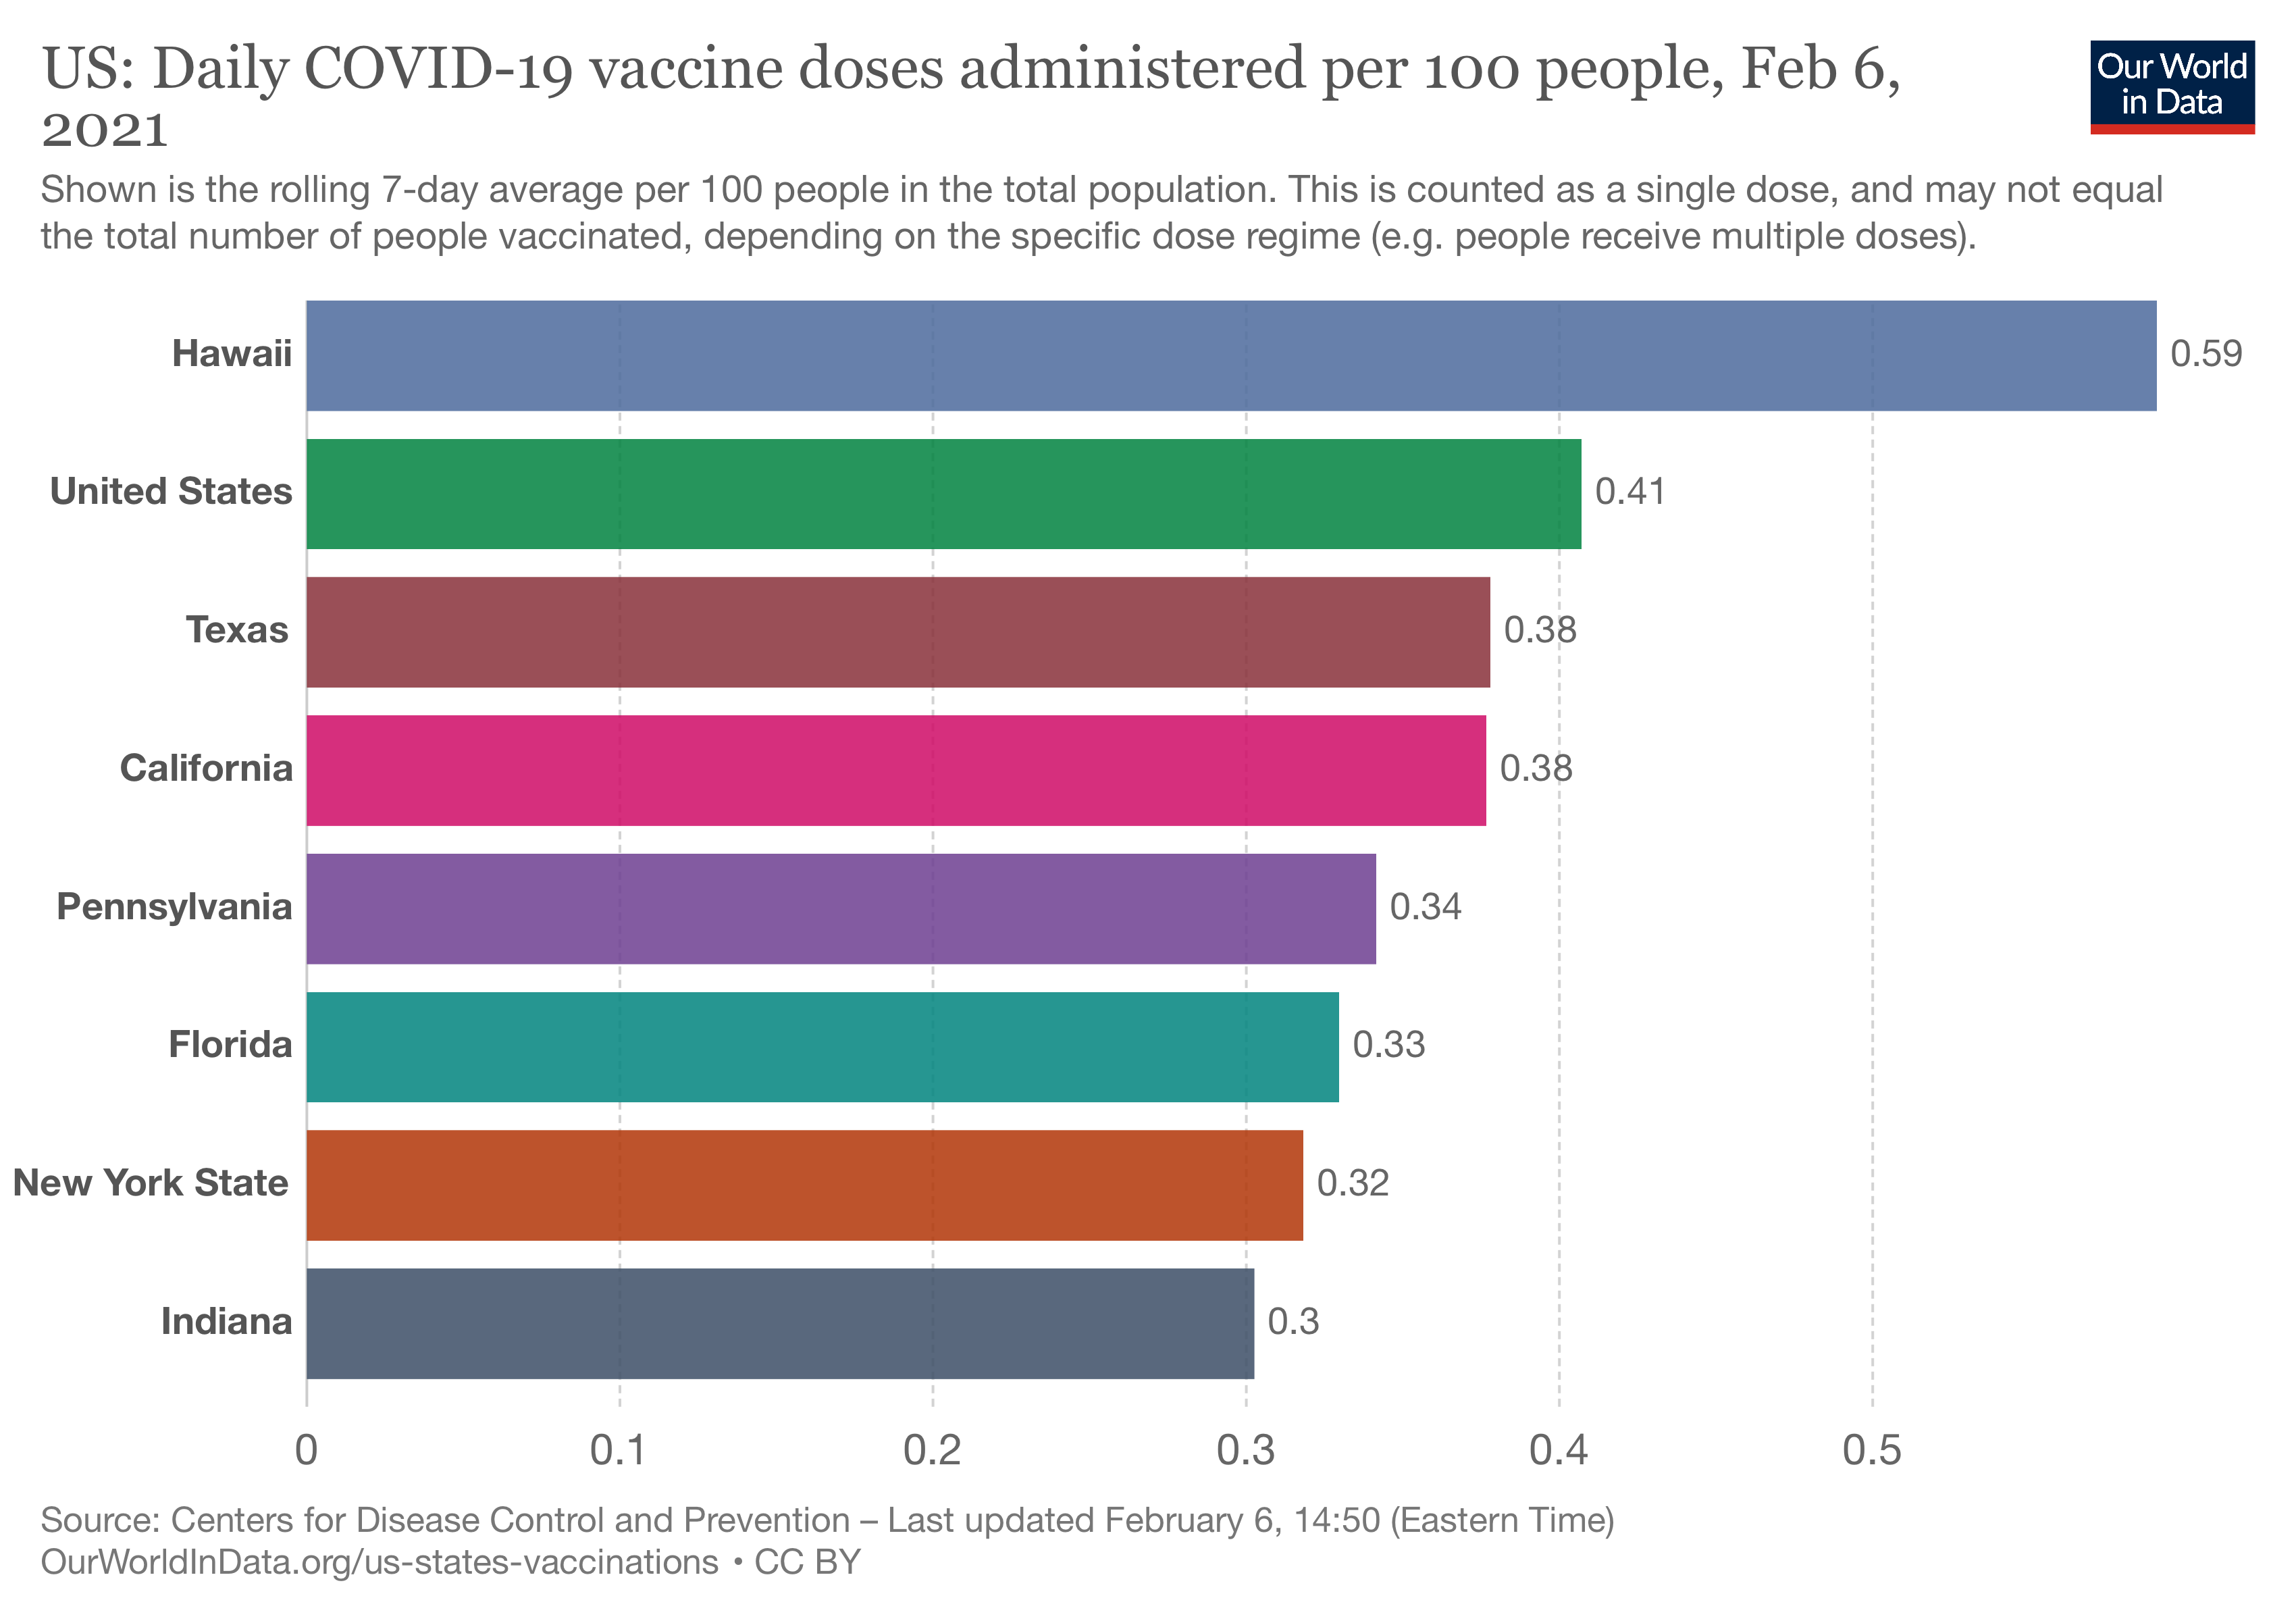
I have included the best and worst-performing states along with our five most populous. The good news the US overall is inching closer to the 0.58 needed to fully vaccinate a million people a day – bringing herd immunity in roughly nine months, happy 2022. The improvement is slight, as are the changes for the individual states. New York showed a drop, in part due to 4 days of closure because of inclement weather; same for Pennsylvania.
Vaccine in the pipeline
Here is how much of the allotted vaccines have been used.
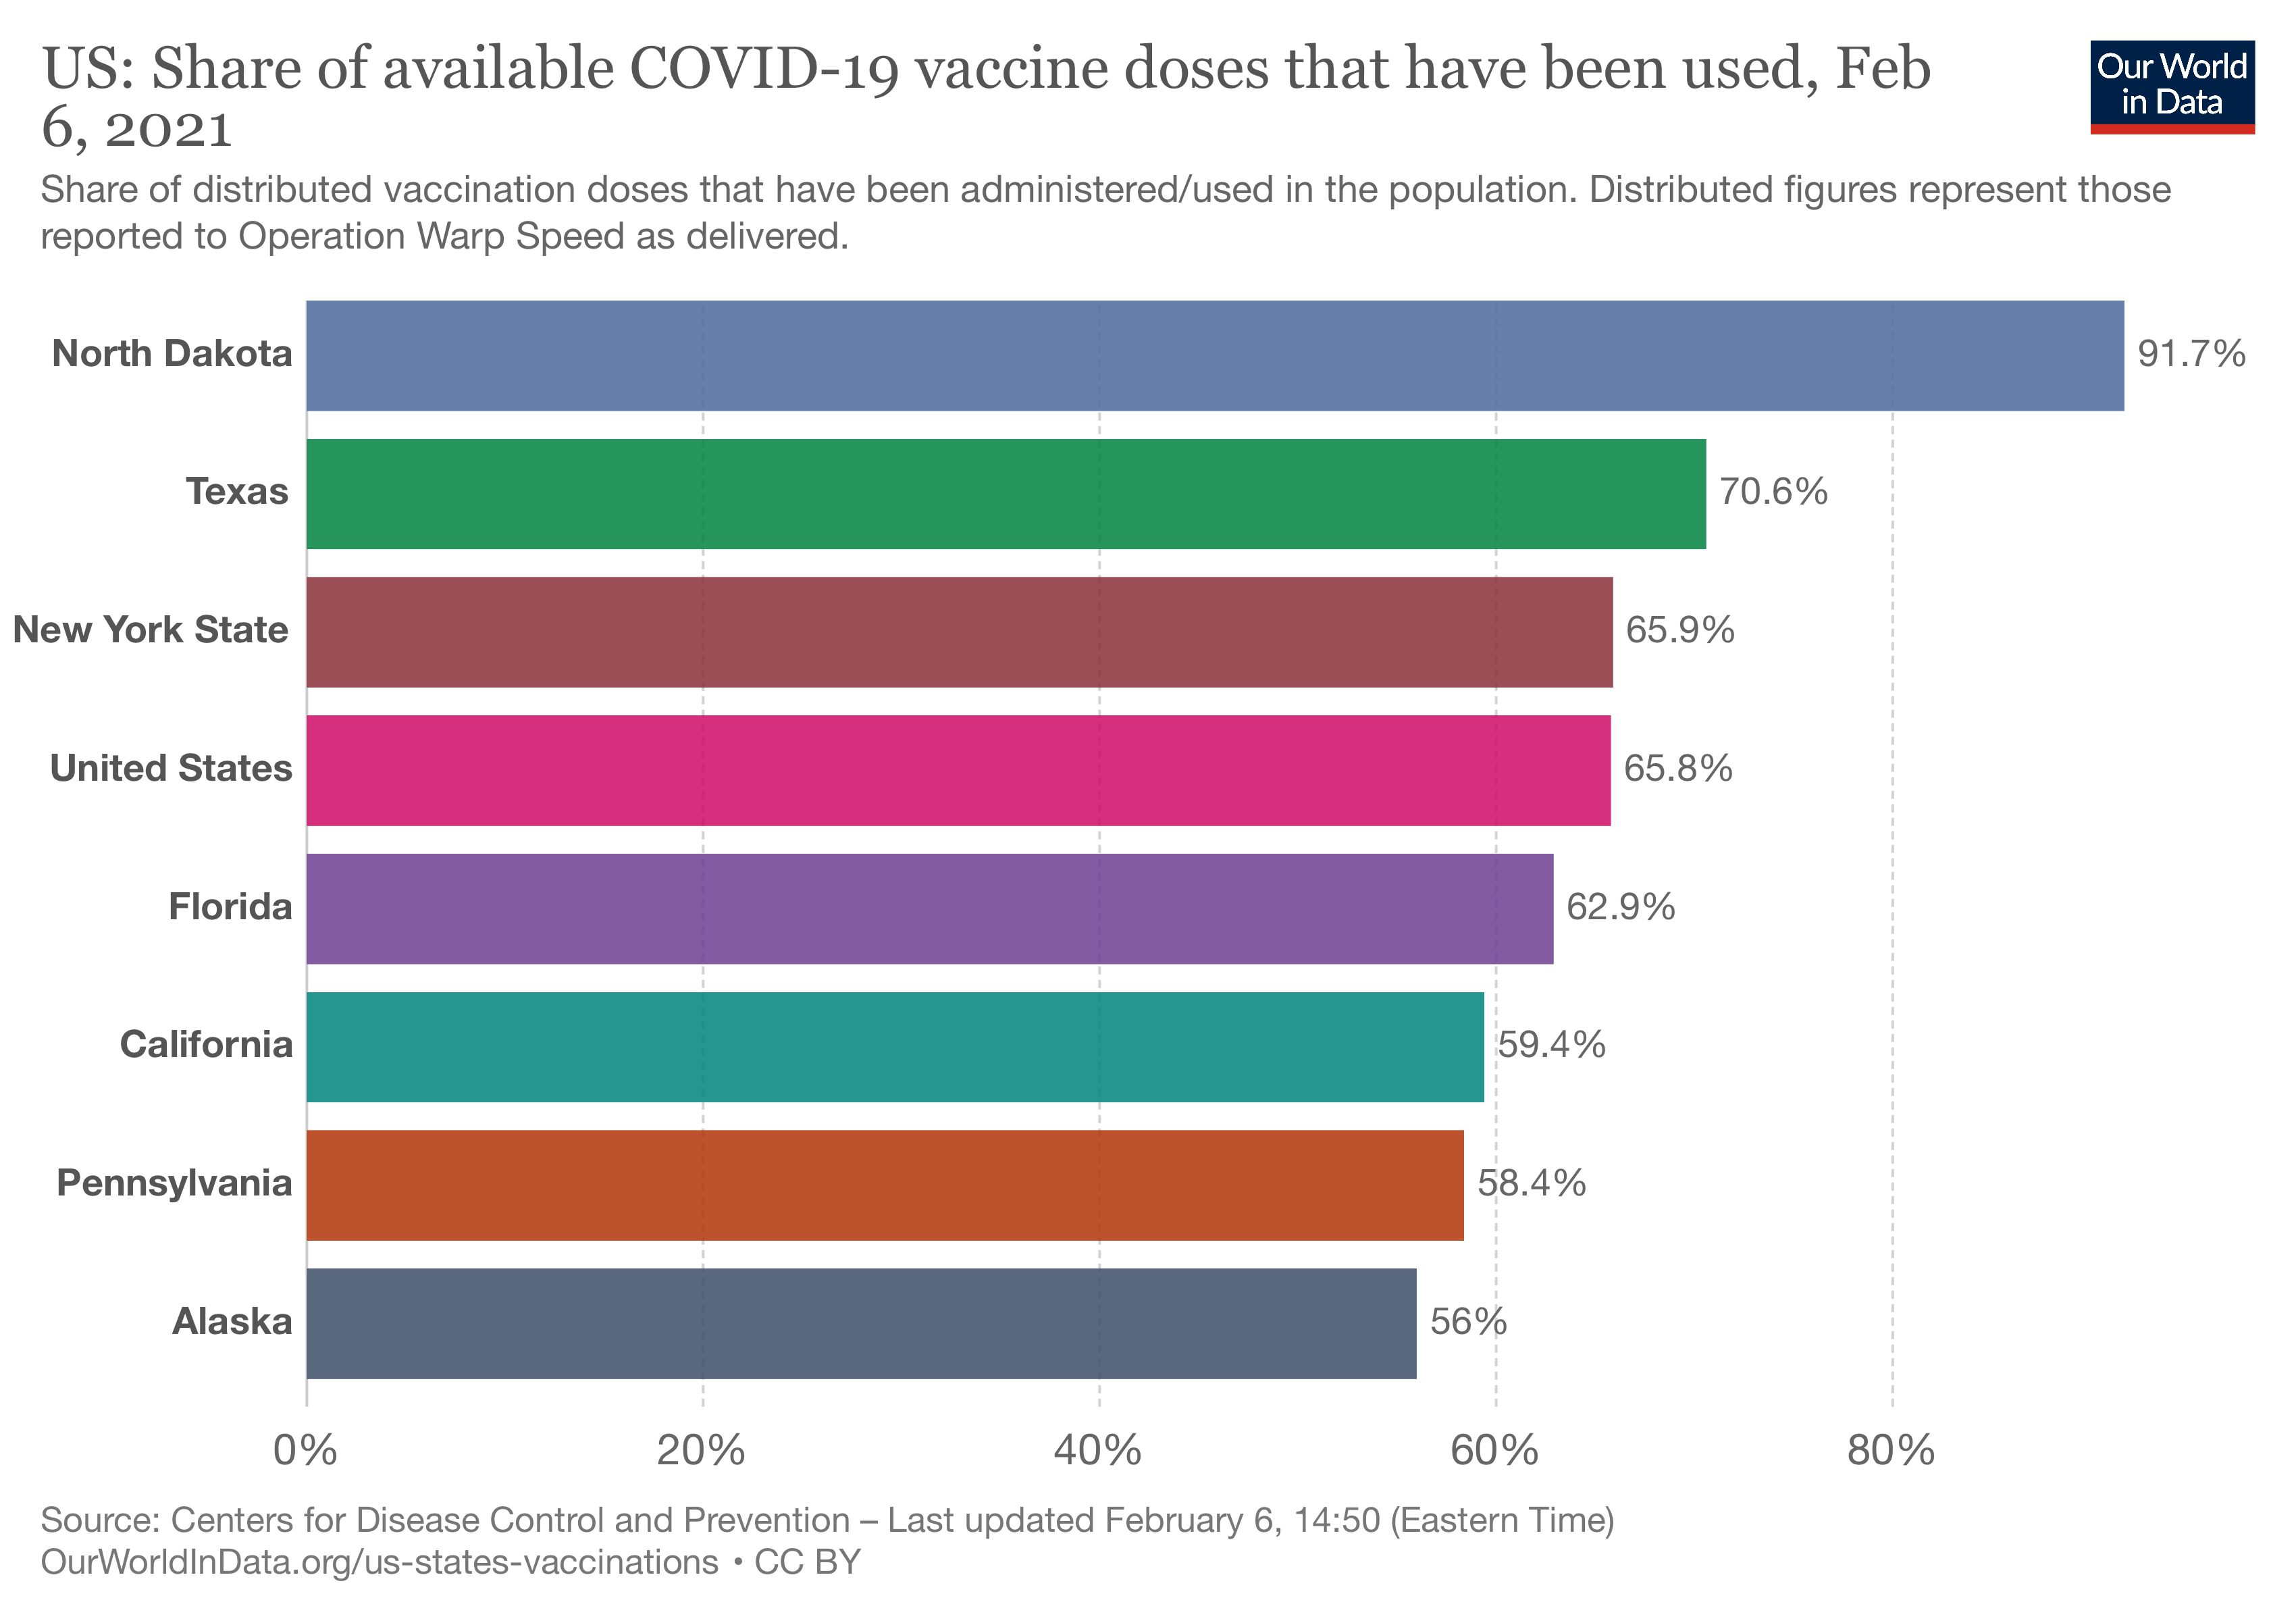
Again, the best, worst, and five most populous states. The numbers for the big states have all moved up by about 5%, as has the US. Now whether this reflects holding back a "buffer" of second dose or a continued operational inability to get the vaccine into arms is unclear from the data.
Finally, a word on herd immunity. Last week, I wrote about India, which has a very high percentage of asymptomatic individuals but whose blood markers show they have been exposed to COVID-19 – they have natural immunity. The media reported another milestone in the US this week when the number of people vaccinated exceeded the number of individuals that had documented COVID-19. That would mean that roughly 15% or more of our population has some degree of immunity. The current CDC estimates are that there have been 83 million estimated infections, which would bring the percentage of individuals with some degree of immunity to nearly 30%. Without testing the general population for COVID-19 signature antibodies, we cannot make any better guesses about the number of individuals with a sub-clinical, asymptomatic COVID-19 infection. Even if we were to test a large sample, the quantity of antibodies declines over time, so any number we determine will be fuzzy. That said, we are probably closer to herd immunity than the numbers of vaccinated or symptomatic cases reflect.

Chuck Dinerstein, MD, MBA
Director of Medicine
Dr. Charles Dinerstein, M.D., MBA, FACS is Director of Medicine at the American Council on Science and Health. He has over 25 years of experience as a vascular surgeon.


