
A recent paper in Physics of Fluids that blends physics and climate with the traditional SIR pandemic model provides some clues. It is a model and does not promise predictions, just insights into how various parameters interact.
“The most reliable models are not necessarily the most complex ones but are those which contain fewer parameters.”
The basic SIR model involves susceptible, infected, and recovered individuals. How one moves through each category is dependent upon transmission and recovery rates. This study tweaked transmission rates to account for climatic conditions. Of course, we return to those airborne droplets and aerosols created when we speak, cough, or sneeze to talk about transmission.
We know a great deal about aerosols and droplets' physics but have little in vivo information because we just don’t have adequate instrumentation. The bulk of our knowledge comes from water droplets' physical responses; we impose some biological assumptions on those drops to account for viral or bacterial biology – devilment can be found in those assumptions, be warned. The research contribution was to estimate the concentration of viral particles in our respiratory “fumes,” accounting for temperature, relative humidity, and wind speed. The assumption, greater concentration enhances infectivity.
Our respiratory fumes are expelled at various rates, moving faster and further with the force of exhalation. Once airborne, gravity begins to pull them down, and temperature, relative humidity, and wind speed alter the concentration of viral particles contained in that water vapor at varying rates.
- Higher temperatures result in less concentration of viral particles
- Higher relative humidity and wind speed increases their concentration
- Higher concentrations are associated with greater transmissibility
As with anything in the real world, it is a bit more entangled and complex, but the researchers created a parameter that captures these effects and introduces them into the conventional SIR model's transmission rate.
“At high temperatures and low virus concentration rates, the virus is in its weak state. At low temperatures and high virus concentration rates, the virus is in its strong state.”
Strong and weak are descriptions of transmissibility. Here is the model they produced based on the climate in New York. Climate data from January through the end of October was used to predict New York city’s weather from November until now.

The chart is a little busy, so let’s break it down. That top line shows the transmissibility of COVID-19 based upon temperature, relative humidity, and wind speed. It was low in the summer and returned to high levels at the end of October. The red line shows those infected by COVID-19. You can see the initial peak in late May and note that blue dotted line, the number of individuals still susceptible but currently not infected. All is quiescent until the end of October, when climate again promotes high transmissibility. The second peak of infectious occurs, and the number of susceptible individuals decreases as more and more become ill.
Here is the graphic of new cases in New York as reported by the NY Times.
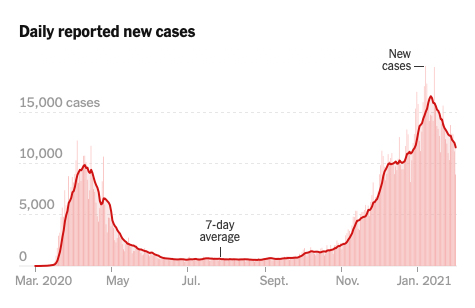
Looks familiar. Remember, the model did not account for changes in our behavior, masks, social distancing, or the vaccines. It only modified the traditional model to account for climate’s impact on transmissibility. That is why it is essential to look at the lines' shape, not the actual numbers. Masks and social distancing flattened the amplitude of the curve, not its basic form.
While the parameters remain the same, the peaks should be offset by six months if we travel to our Southern Hemisphere. They also should show shifts as we move out of transmissibility's sweet spot further towards the pole or equator. The seasonality of respiratory viruses, flu, and COVID-19, is driven, in part, by our climate. In modeling terms, pandemic models are sensitive to differing weathering seasons.
Source: Fluid Dynamics and Epidemiology: Seasonality and Transmission Dynamics Physics of Fluids DOI: 10.1063/5.0037640

Chuck Dinerstein, MD, MBA
Director of Medicine
Dr. Charles Dinerstein, M.D., MBA, FACS is Director of Medicine at the American Council on Science and Health. He has over 25 years of experience as a vascular surgeon.


