The media took an optimistic assessment of the current situation, but new cases remain far worse than when the pandemic began in March of 2020 or at the subsequent low point in June. The CDC opined that we need to get down to 10,000 cases per day (30 new cases per million population) for a reduction by a factor of ~5 in order to declare victory; based on data through April 30, we are still a long way from “normal”.
Temporal Trends
The national data show a cyclical pattern in COVID-19 cases spanning an order of magnitude over the last year.
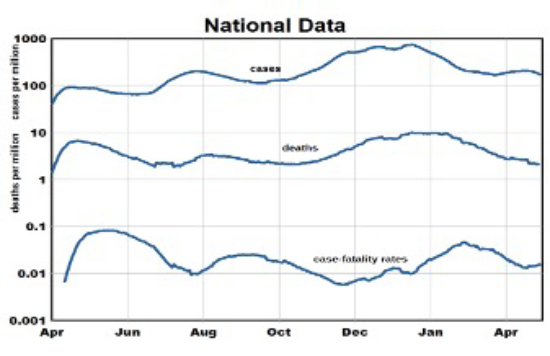
- The low points in June, September, and March define a “baseline” background level that may represent increased spreading of the virus during the pandemic.
- Death rates followed similarly with a lag of several weeks but an essentially flat baseline. Deaths have been around 700 daily from mid-April to early May – we see no basis for expecting future reductions.
- Case-fatality rates show 3 waves from the baseline rate of about 1% leading to about 100 deaths per day if the CDC goal were achieved - much less than the current losses from seasonal influenza or suicide.
- The timing of the waves suggests seasonal variations in cases that we correlated with temperature, with a low in June after startup and a high in December. A seasonal drop of 400F would increase cases by a factor of 5. This is one of the strongest relationships we have found but it remains to be seen if it will persist through the year.
- The cyclical variations seen in national cases and deaths suggest coherence among regions, perhaps due to common seasonal effects.
Regional Variations
Based on current regional trends, we postulated two types of potentially responsible factors: situational (climate, population density, ambient air quality, built environment, spreading of virus variants) and personal/behavioral(education, exposure mitigation, income, race, obesity, diabetic status, vaccinations). We assume that situation factors varied among regions but remained constant during the pandemic. Behavioral factors differed by region and varied over time and displaced the trend lines. They pertain to the characteristics of states of residence rather than COVID-19 victims.
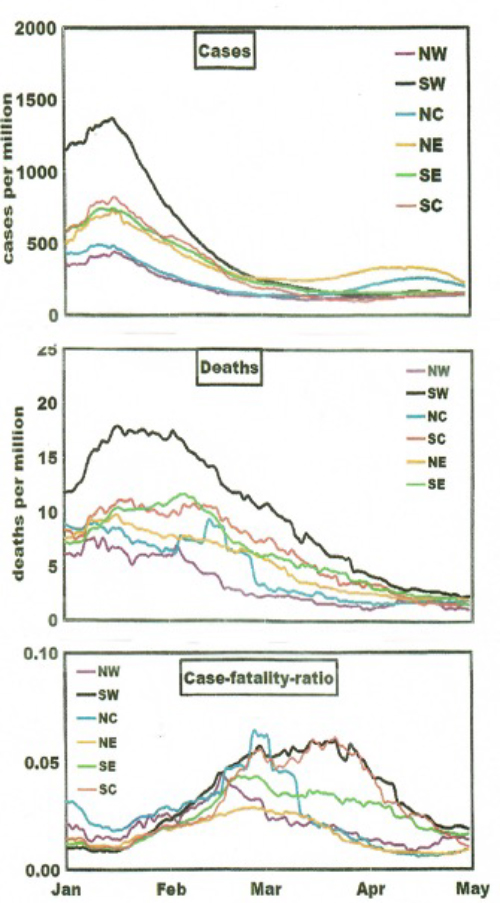
- We found significant relationships with political preference, race, household crowding, education, obesity, diabetic status, and traffic-related air pollution.
- A 60-point increase in Republican voters was associated with doubling of cumulative cases as was a 60% decrease in face-mask usage.
- Commonality in CFRs would appear to rule out regional differences in age at infection or differences in the efficacy of medical care.
- Factors like season or political preference may affect indoor vs. outdoor exposures or the propensity to follow CDC guidelines.
Where Do We Stand Now?
- Temporal trends were affected by seasonal factors and the accompanying behaviors, some of which were quite strong.
- There may be no upper limits on daily cases or deaths, but any lower limits would be set by the “baseline” values seen in June, September, and March.
- Given the minor differences in April trends relative to January, for example, predictions for the future seem quite problematic.
Trends follow quasi-seasonal patterns in which regional timelines are displaced according to their different demographic and geographic situations, some of which affect virus exposures. Personal behavior controls risk factors and their relative importance. The virus is out there and likely to remain so. Dealing with it is up to you.