
The CDC and others are sounding alarms about COVID hospitalization rates increasing by 20% in recent weeks. Still, they neglected to mention that these rates are down 3-fold for the year and that some Western regions have held steady while infections in New York and Washington, DC have increased twice as rapidly. We have been studying COVID since the pandemic's beginning and applied those lessons to the present situation. Percentage changes from the low 2023 baseline will always appear more important.
Based on available CDC data, we looked at hospital admissions and deaths in 2023 for the entire US, its 10 Federal Regions, and 48 contiguous states. We considered hospital admissions and deaths because they are counts of individuals rather than interpretations of infection testing or analysis of wastewater surveillance. Hospital admissions and deaths varied widely at the beginning and end of the year, having achieved new lows in July. While most regional admission rates increased in December, mortality rates did not. The highest national hospital mortality rate was 0.10 in January, and the lowest was 0.06 in August.

State Variations During 2023
These time-history graphs clearly demonstrate national trends but do not offer a clear understanding of regional trends in vaccinations or demography that might have affected hospitalizations and mortality. We compiled datasets by outcome, month, and state to examine these possibilities.
July admission rates were only about 10% of the January rates but with persistent spatial patterns. A state with substantial improvement from January to July suffered the largest relapse from July to December. 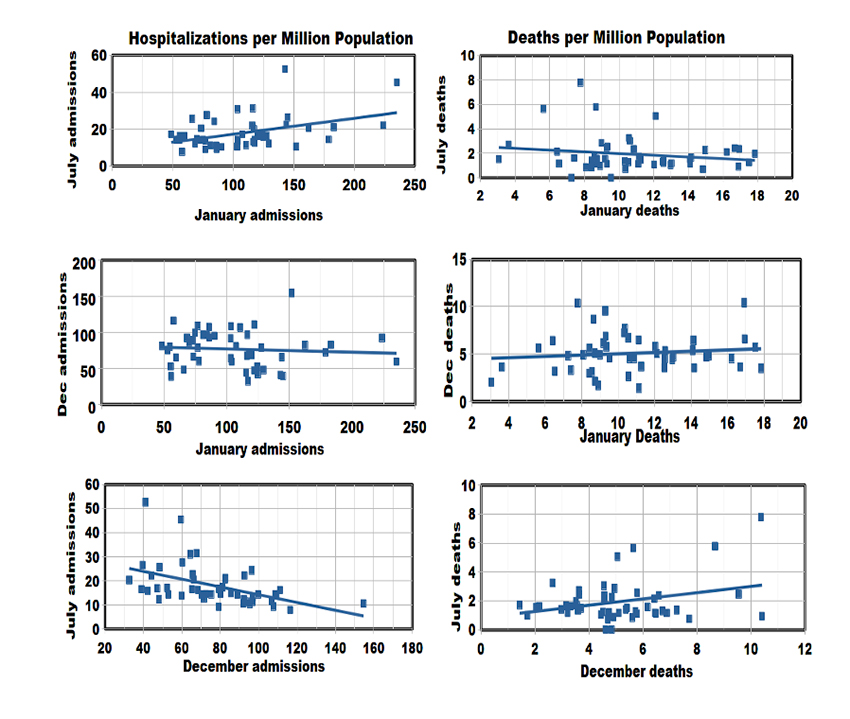 Hospitalization rates were consistent among states as they initially decreased but not as they subsequently increased. By contrast, no spatial relationships were statistically significant among state-level deaths. We also noted that long COVID symptom rates have been steady in 2023.
What Did We Learn?
We believe the absence of significant COVID deaths or admissions in late 2023 resulted from random noise in this setting of very low rates of occurrence. While there have been calls for preventative measures to counter the current modest increases in COVID infection rates, it is unclear which measures might be effective. We tested state-level relationships between 2023 COVID cases and vaccination rates from various periods. There were strong negative relationships in 2021 and 2022 between vaccination and cases when COVID rates were much higher, but that relationship was lost in April 2023 when COVID rates were much lower. Other studies have shown reduced vaccine effectiveness in 2023.
Will a new variant produce another strong peak in 2024?
“An enthusiast does not always realize that what is of profound interest to himself may evoke only an amused tolerance in others.”
- William Pickles MD, First President Royal College of General Practitioners
This axiom applies to modelers and prognosticators as well.


