
This type of study is referred to as ecologic since it is based on locations (counties) rather than individual patients. Such studies have often been considered inferior to cohort studies of individuals about which key properties such as age and smoking are known, improving precision. However, about 10 million persons were infected during the pandemic, of which about 170,000 died and following a cohort of this magnitude is clearly impractical.
To investigate such variations, we assembled a national data set of the 100 most populous counties, each including a major city. We studied cumulative cases and deaths to account for temporal variations during the pandemic and used linear regressions to evaluate associations with plausible county characteristics that might help explain this variability.
Methods and Data
We extracted cumulative case and death counts from the GitHub database as of May 16, 2021, and converted them to rates by dividing by the population in millions. We selected 10 socio-demographic variables and 7 ambient air quality measures as potential predictors of COVID rates (see Table), each of which was considered a “county indicator” rather than a direct measure of individual risk. [1]
The air pollution data was limited by availability. [2] We included fine particles (PM2.5, which has been considered elsewhere), as well as two of its key constituents, sulfate aerosol (SO4) and elemental carbon (EC). We also considered the effects of vehicular traffic locally in terms of nitrogen oxides (NOx) and regionally in terms of ozone (O3). The working hypothesis about air pollution is that previous long-term exposure may predispose to adverse respiratory conditions.
Not all of these variables are independent, e.g., the correlation between EC and NOx is 0.92 since traffic sources dominate both. Other similar factors are not correlated, like household income and the percentage of poor or percentages of Republican voters with percentages of elderly. We used multi-predictor models selected from the strongest bivariate relationships.
Relationships with single predictors.
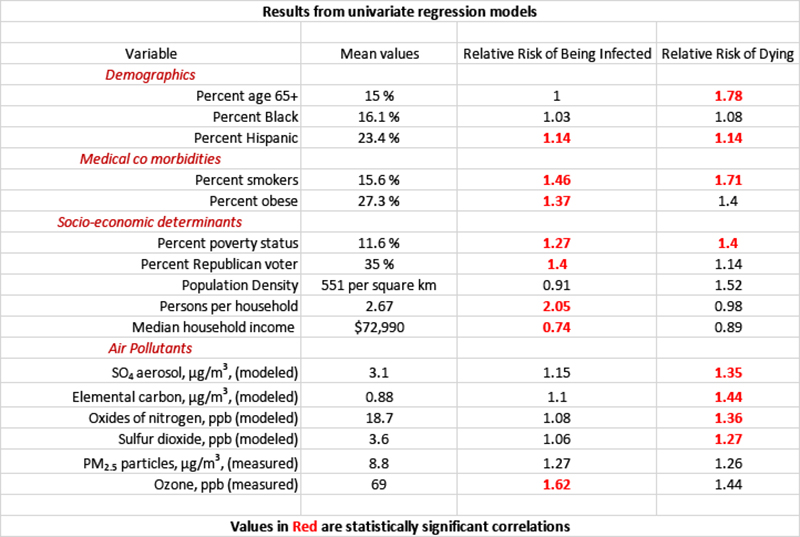
- The percentages of smokers, Hispanics, and those with poverty status were statistically significant predictors of both cases and deaths.
- Based on mean values, persons per household had the largest risk on cases – adding one more person to a household would increase the infection rate in that household by 31%.
- The percentage of those aged 65+ had the largest effect on deaths - doubling the percentage of persons aged 65 or more triples COVID’s mortality death rate.
- The air quality variables based upon models rather than measured concentrations had the strongest relationships with deaths.
Each of the above variables describes the county rather than individual residents.
Relationships with multiple predictors.
Multivariate models are necessarily helpful in understanding the relationships among the 100 counties. We used a trial-and-error approach to find the most effective combinations. Here are the regressions, both of which are highly statistically significant.
Cumulative cases per million = 18,200*1.81 (persons per household) *1.58 (% smokers)*1.19 ( %Republicans)*1.19 (% Hispanics) * 1.17 (SO4) * 1.10 (EC).
Household density and smoking demonstrate the greatest impact on case volume, the impact of % of Republicans and Hispanics, and the two air quality measures are three to fivefold less.
Cumulative deaths per million = 260*1.96 (% 65+)*1.40 (% smokers)*1.42 (% Hispanics)*1.53 (SO4),
Age had the greatest impact upon mortality; the remaining three variables, smoking, Hispanic ethnicity, and SO4, had half as much impact.
These regression values allow us to estimate the risk to an individual with that characteristic.
- For a death attributed to COVID-19, a smoker’s relative risk was 8.5, a Hispanic person’s was 4.5, and an elderly individual was 88.
- For a COVID-19 infection, a smoker’s relative risk was 19, a Hispanic person’s was 2.1, and a Republican’s was 1.7.
- All of these COVID-19 risk factors are substantially larger than what has been reported for all-cause mortality.
- Among the air pollution variables, only SO4 retained statistical significance in multivariable models; PM2.5 was usually negative and never significant, which could have resulted from inappropriate timing of the measurements as well the absence of physiological effects.
We conclude that a large portion of the observed variance in COVID-19 effects among counties may be associated with differences in situations (residential crowding, ambient air quality) and personal factors (smoking, age, ethnicity, politics).
[1] The demographic data were obtained from Census sources, County Health Rankings, and the 2020 Presidential election. We considered two ambient air quality data sources: air dispersion modeling or as extracted from the EPA database of county-average measured values.
[2] Our data on SO4, EC, and NOx were from 2002, and the PM2.5 and O3 data were from 2020.


