Separating Fear from Fact
We’ve come a long way from the rotary phones of our childhood (depending upon your age, of your parents or grandparents). In 2021, the number of cell phone users in the world was estimated to be 5.3 billion. More than two-thirds of the world’s population has a cell phone, and the number of cell phone users grew by 117 million in the past 12 months alone. In the US, there are an estimated 294 million cell phone users - more than 80% of the total population. This is not a passing trend going away any time soon!
With increasing cell phone use has also come scary press reports of the association of cell phone use with cancer, particularly brain cancer. If cell phones cause brain cancer, wouldn’t we see a steep increase in brain cancer? Cell phone use did not become widespread until the mid-to-late 1990s, so looking at the incidence data for brain cancer should give us a clearer picture of whether we need to be concerned.
A study that did exactly that presents reassuring results. This study examined brain cancer incidence trends in the US in relation to cell phone use from 1977 to 2010. They examined age-specific trends, considering the year of diagnosis and reported that brain cancer incidence rates have declined since the early 1990s. The only period of increasing brain cancer rates was in the 1970s and 1980s, due to the introduction of CT and MRI scans in this period, making it possible to detect cancers that would previously have been undetectable.
Why Does the Environmental Working Group (EWG) Demand Lower Guidelines?
How did the EWG set its guidelines, and how credible is it?
The Approach
The guidelines follow the same approach used by federal regulators, such as the EPA, when deciding what a “safe” limit for exposure to a chemical or, in this case, exposure to radiofrequency radiation is.
The most accurate way to set guidelines would be to expose people to various amounts or doses of radiofrequency and see at what amount they become ill – then setting the guidance level somewhat lower than that since that would be a “safe’ level. Obviously, that sort of experiment is ethically unacceptable. So, scientists utilize the results from studies on animals, usually rats and mice, to set guidelines.
As discussed in the previous article on experimental design, there are all sorts of problems with using studies in animals to determine safe levels for people. Some of the problems are the very high doses and unrealistic exposure scenarios used in animal experiments. However, these experiments provide helpful information and are the basis for most of the regulatory guidance today.
Consider the following experiment:
- Four groups of rats. The control group had no radiation exposure (every good experiment has a control group).
- The other three groups of rats received increasing doses of cell phone radiation, shown on the x-axis – “Amount of Radiation” as 1, 2, and 3.
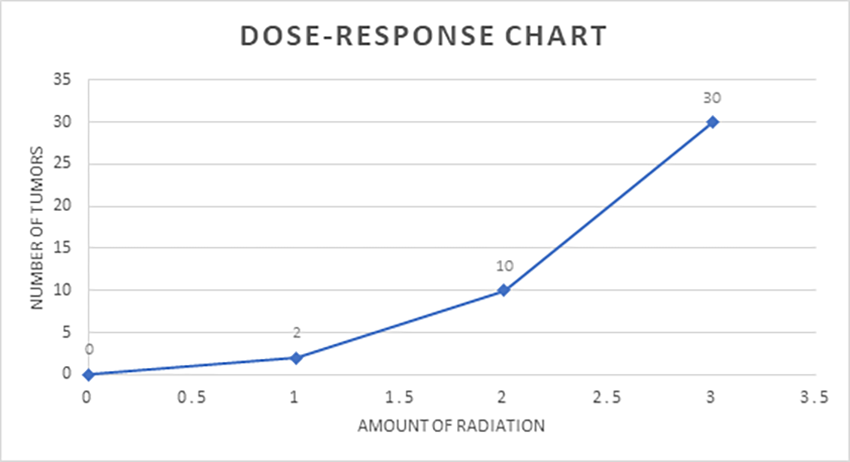
- The control group had zero tumors, Group 1 had two tumors, Group 2 had ten tumors, and Group 3 had 30 tumors.
- Increasing doses of radiation resulted in increased numbers of tumors. (For simplicity’s sake, the amount of radiation is labeled as 0, 1, 2, and 3. In the actual experiment, they would be marked with the units of measurement of the radiation, such as watts-hrs.
It is essential to understand that the rats and mice used in these experiments are specialized breeds (not those pesky ones we try to keep out of our houses) bred to be genetically identical and not at risk for cancer or other diseases. The control group represents what happens when people are not exposed to radiation or a chemical.
The chart below is a simplified example of the results from our hypothetical study. It is called a dose-response chart because it measures the dose, which in this case is the amount of radiation applied to the rats, vs. the response, which is always a health effect. In this case, it is the number of tumors in the animals.
The scientists developing the guidelines would take the results from this chart and use models to determine the safe level of radiation exposure. However, it is crucial that scientists not blindly use the results from these studies - the results need to make sense.
What does this chart tell you?
The study should show a dose-response relationship, as depicted in the chart. A higher dose should result in more severe health effects than a lower dose, as demonstrated by an increasing number of tumors as the dose increases.
There can be lots of explanations for data that doesn’t show a dose-response. Usually, it is due to a problem with the experimental design or the procedure in carrying out the experiment. In this case, the data should not be modeled and used to set guidelines.
It is also very important that the results are statistically significant. This means that a determination has been made based on statistical analysis that the result did not occur by chance.
A Statistical Pause
The term “statistically significant” is used frequently, but it’s not always clear what the term means. Measurements vary from time to time – a certain aspect of making measurements is random. If we make, say, a dozen measurements of anything – temperature, barometric pressure, a person’s height, or anything else, the measurements won’t all be the same every single time. Think of weighing yourself on your bathroom scale.
Similarly, if we measure the incidence of cancer in groups of people – or of rats – then it’s not unexpected for different groups to have different numbers of cancers. If you buy 100 bags of M&Ms and count the numbers of each color in each bag, there will also be some variability. This is how the universe works. What we need to be able to do is to know when any “extra” numbers we see can be explained by normal variability – if not, then we say that the extra…whatever it is we’re measuring…is “statistically significant.”
There are several mathematical tests that scientists and statisticians can perform to determine if “extra” cancers are statistically significant. If they’re not, then the additional cancers (or a reduction in cancers from what was expected) cannot be said to have been caused by the agent being studied – no more than finding an extra green M&M in one bag would indicate a breakdown in the M&M factory.
If the number of tumors at the different radiation levels is not statistically significantly different from the control group, tumors should not be modeled.
The EWG violated both of these rules in setting their guidelines; the data they used did not show a dose-response relationship, and certain results were not statistically significant!
The Specifics
The EWG used data from the results of 2 studies, one in rats and one in mice, carried out by the US National Toxicology Program (NTP) to set their guidelines.
The NTP exposed rats and mice to high levels of radiofrequency radiation over their entire bodies for two years. At the end of the studies, both the rats and mice were autopsied, and all their organs were examined for many diseases, including cancer. In the mice study, no significant increases in any disease, including cancer, were observed.
In the study using rats, very few significant effects were noted. The only statistically significant results in the rats were an increase in:
- cardiomyopathy (disease of the heart muscles) only at the highest radiofrequency “dose.”
- tumors of the pituitary gland, adrenal gland, and prostate gland. These tumors were not seen consistently and did not follow a dose-response relationship, i.e., they did not increase with increasing doses of radiation.
The EWG modeled all of these effects and for brain tumors, even though there was no statistically significant increase in brain tumors.
The EWG used heart muscle disease as the basis for their guidelines, even though this is not relevant to real-life cell phone exposure. As noted in the article on experimental design, the heart receives an extremely low dose of radiation from cell phones due to the distance and that the radiation needs to pass through the tissues of the head, neck, and chest first. In addition, the rats only experienced significantly increased heart muscle disease at the very highest dose, which was much, much higher than any amount of radiation coming from a cell phone.
Conclusions
As our computer and modeling power gets more and more sophisticated, the challenge today is to be able to remember the question you are trying to answer. For cell phones, the question is whether they cause cancer or other diseases? The NTP studies found no evidence that this was the case. The EWG’s analysis, they didn’t perform the actual NTP studies, modeled health effects that were sporadic and not related to the human cell phone experience. Additionally, the EWG presented a blizzard of modeling mathematics, making it extremely difficult to identify the original underlying data and understand the assumptions built into the models.
Their phrasing in their analysis often obscures the results, with sentences such as,
“A complex dose-response relationship also was seen for the tumors in the heart, brain, pituitary gland, adrenal medulla, prostate gland, and liver,”
which translated into plain English means that no dose-response relationship was seen.
The results from the human studies and the NTP studies in rats and mice should be reassuring to everyone who use cell phones. Brain cancer rates are not increasing in the US, and studies in animals show no worrisome effects. In summary, the EWG guidelines will not change my use of cell phones, so all of us can get back to worrying about the battery lives left in our cell phones.
The Series
Part I – Do Cell Phones Cause Cancer
Part II – Radiofrequency Radiation and Cancer
Part III - Experimental Design (or why rats are not people – among other things)