
This problem was recognized in 2021 when 27 states embarked on various incentive programs to increase public participation. A study in JAMA Network Open characterized the varying state incentive programs.
- Lottery programs with cash prizes (28 states, median prize = $10,000).
- Guaranteed cash payments (10 states, median = $100).
- Scholarship programs (17 states, median value = $10,000).
How well do incentives move people towards vaccination?
To address this question, we assigned a score of 1 for each incentive offered by the state. Eighteen states provided no incentives (score of 0); 3 states offered all three (score of 3). The national mean score was 1.14. We then computed vaccination rates for the states as reported by the CDC. [1]

Although there are slight increases in coverage with the lottery incentive (about 7%), the incentive programs offered only minuscule improvements compared to states offering no incentives.
What are the determinants of vaccine coverage?
Socioeconomic factors can be critical, especially political persuasion, as shown in the graph below. Recognizing that other socioeconomic factors may also be important, we replicated the analysis using household income as the indicator. These graphs are based on percentages of the entire population and are nearly mirror images because the two indicators are highly correlated (R=-0.62). They both show consistent associations with the 4- phases of vaccination.
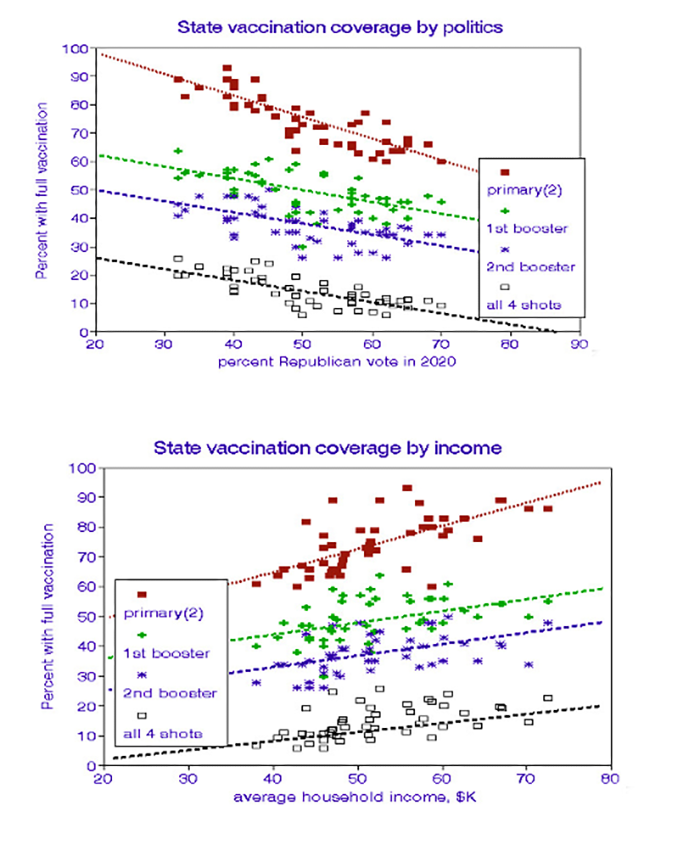 In comparing the two indicators, statewide political persuasion is more precise and thus statistically preferable because it is based on individual counts, like comparing the numbers of red and blue vehicles in a parking lot, for example. By contrast, statewide household income is an average over a wide range and might be comparable to estimating the average weight of vehicles in a parking lot that includes both semi-trailer trucks and passenger cars.
In any event, the graphs only represent associations and not necessarily causes and effects; changing your voter registration will not affect your attitude about vaccination. The modest incentives tried were ineffective, and the graphs present a very discouraging outlook.
Fractions of the population covered by updated vaccines are minuscule and likely to remain so.
[1] The “original series” reflects population percentages; the booster data reflect percentages of those having received the initial series.


