
"(Fossil fuels) are the root cause of air pollution and climate change." New England Journal of Medicine [1]
Global Trends
Much concern about climate change focuses on trends in inputs (air pollution emissions) and outputs (global mean temperature and CO2). The best indicator of global CO2 comes from the observatory atop Mauna Loa, Hawaii, where ambient CO2 has been recorded since 1958, with estimates back to 1900 based on ice core data. Ambient CO2 has increased steadily at a rate of 0.24 %/year.
The steady increase of Mauna Loa CO2 indicates no response to various attempts to reduce CO2 emissions. However, other potentially influential factors have changed and should be considered.
- Population. Despite a growing global population, global CO2 emitted per capita has remained essentially constant since 1970, at about 4-5 tons per year for each person, 10% of which is from breathing. Total per capita annual CO2 emissions are about 15 tons in the US.
 Industry, Transport, Power Generation. A common parameter in air pollution analysis is “yield,” the incremental ambient concentration corresponding to a given emission rate. The ambient yield from global emissions has decreased by about 50% but may now be leveling off, a trend deserving further investigation.
- Gross Domestic Product (GDP) a measure of economic activity, is highly correlated with population, averaging about $10,000 per capita.
- US Air Pollution Emissions. There have been many attempts to link emissions of regulated (“criteria”) air pollutants with climate change. However, emissions have declined by 73% in the US since 1980, while CO2 at Mauna Loa and global mean temperature continue to increase. This contradiction effectively rules out traditional air pollution as an important contributor to global warming.
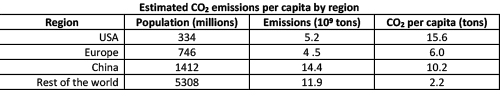
The graph depicts the growth rates for these parameters. The US contributes about 14% of global CO2 emissions and accounts for about 14% of the global Gross Domestic Product (GDP), with only about 4% of the world population.
I used regression analysis of longitudinal data to develop models of global mean temperature as functions of global CO2 emissions, population, and GDP. All of the models predicted global mean temperatures within about +/- 7% at the 95% confidence level. The best global temperature prediction model includes world population and Mauna Loa ambient CO2, both of which are measured very precisely. Measures of CO2 emissions performed poorly, not because of absence of effect per se but presumably because of the relative imprecision of measurement. The impact of GDP could not be distinguished from those of population.
Relative Effects of US CO2 emissions
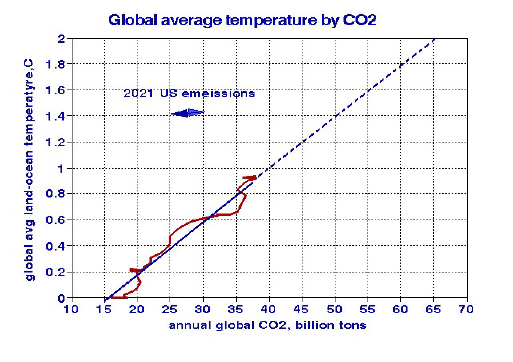 I then used these modeling results to estimate the contributions of our 334 million people and 5.2 billion tons of CO2 to global mean temperatures. Total elimination of US CO2 emissions would reduce global mean temperature by less than 10%. The bottom left portion of the graph (solid line) shows the linear regression fit, and the upper portion (dashed line) shows the extrapolation to 2oC, the level at which irreversible terrestrial effects are predicted. This corresponds to a 75% increase in global CO2 emissions to about 6.5 tons per capita but still far below the current US level (15 tons per capita). According to this model, if the world population reaches 8.8 billion, global temperature would reach 2.0oC by 2045 even if emissions remained unchanged.
Linkage With US Emissions Of Regulated Air Pollutants
While ambient CO2 and global mean temperature continue to rise, US emissions of regulated air pollutants have declined since the Clean Air Act in 1970 and subsequent amendments.
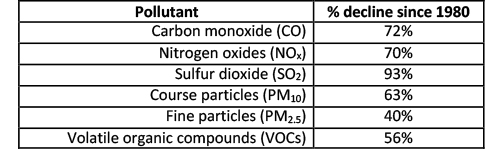
None of these pollutants are GHGs per se, but two of the constituents of PM2.5 deserve special attention. Black carbon, otherwise known as soot, is heat absorbent and is thus a “greenhouse particle,” while sulfate particles (SO42-) are heat reflectors [2] and therefore, beneficial. Indeed, one of the climate change strategies under consideration requires spraying SO2 at high altitudes, where it oxidizes to become sulfate and provides a “heat shield” for the earth. The EPA fails to routinely monitor ambient levels of these important species, as is also the case with methane (CH4), a GHG that is many times more potent than CO2.
Nevertheless, the overall messages are clear. There are wide disparities in CO2 emissions per capita globally, with the US as the clear leader. Reducing US CO2, say to European levels, would have little benefit in terms of global mean temperature.
Effects in other regions
China is the world’s largest CO2 producer but projects reductions in population and emission rates that remain to be seen. However, the key to the future clearly lies with the rest of the world, which comprises two-thirds of the population but only one-third of CO2 emissions. Reforming the US may make us feel righteous, however myopic, but controlling future global warming will require the rest of the world to find low-carbon ways to improve their living standards.
This simple macro analysis is intended to be qualitative and in no way replaces the complex atmospheric modeling done by the UN’s Intergovernmental Panel on Climate Change (IPCC), which is based on “first principles.” Such models are the work of hundreds of climate scientists and are intended to trace each molecule of CO2 from exhaust pipe to the sensor at Mauna Loa. One such model predicted hitting 2oC in the year 2042, which is well within the error limits of my analysis.[3]
My analysis focuses on overall dose-response relationships, i.e., how many ppm of CO2 or fractional degrees of temperature result from each molecule of CO2 emitted, regardless of its source. However, I did not consider other GHGs or terrestrial sequestration. It is apparent from the graphs and the statistical analysis that the available global CO2 emissions data need reevaluation.
Prevention abroad may be more effective than reformation at home.
[1] Fossil-Fuel Pollution and Climate Change - A New NEJM Group Series. NEJM DOI:10.1056/NEJMe2206300. PMID: 35704486.
[2] Air Quality and Climate Change Research EPA
[3] Study Confirms Climate Models are Getting Future Warming Projections Right NASA


