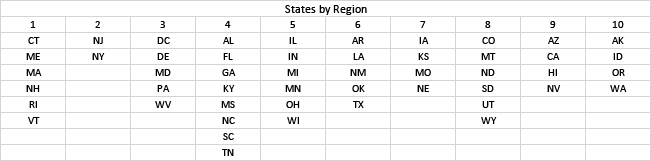
We examined cumulative hospitalization rates and deaths since early 2020 for states and Federal Regions[1] and focused on differences among states and possible explanations for their diversity.
There’s a mysterious pattern in the deadliness of COVID-19. Each country has its own healthcare system and combats the pandemic with varying containment and mitigation strategies.
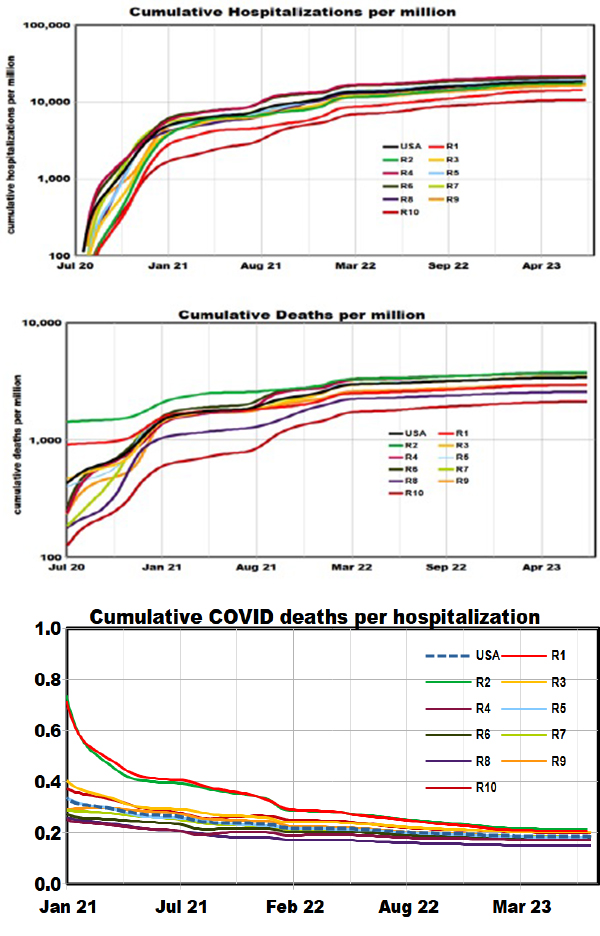 The graphs show that cumulative deaths have now converged to about 3600 deaths per million with a ~3-fold range among regions, but the spread was much larger in the early stages of the pandemic. The inflection point in early 2021 coincides with the advent of the original 2-shot vaccine program; rates ticked upward in late 2021, followed by relief due to booster shots. Mortality rates have been nearly constant since mid-2022 for all regions, but Region 2 (New York and New Jersey) have retained the lead throughout, and Region 10 has remained the healthiest.
Trends in hospital admissions are similar but regional rankings differ; the highest rates were in Region 4 throughout, and Region 10 retained the lowest. As a result, the hospitalization mortality rates indicated the most lethal cases in Regions 1 and 2 and the least in Region 4.
Since the US regions have similar healthcare systems for the elderly, we looked for other factors that might explain the diversity. Because of the similar trends among regions, any such factor would have to have remained constant over time. To improve statistical power, we also examined state-level rates of hospital admissions and deaths attributed to COVID-19.
Financial Considerations
The COVID-19 pandemic has claimed 1.1 million lives thus far. The Federal government estimates the economic cost of premature death at $7 million, leading to an overall cost of about $8 trillion, about one-third of the national Gross Domestic Product. Losses would be much higher in the most-affected states. The total is similar to the estimated loss in financial markets (about $9 trillion) but much greater than the Federal funds allocated to combat the pandemic (about $2.6 trillion).
Distributions Among States
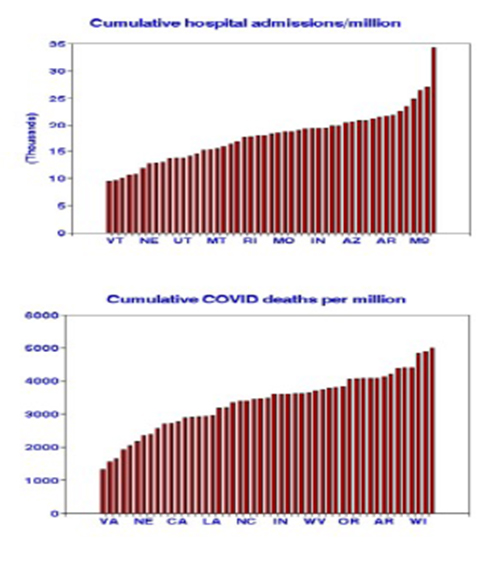 The bar graphs indicate the distributions of hospital admissions and deaths. The distributions are well-behaved with no obvious geographic patterns. The median values are 18,654 admissions and 3598 deaths per million population, for a cumulative mortality rate of 19%. The corresponding national figures would be about 6.2 million admissions and 1.2 million deaths
We selected several demographic and mitigation factors that might explain the variations among states:
- Mean household income ($000)
- Political preference (% voting Republican in the 2020 election)
- Vaccination strategy (% receiving the bivalent booster shot).
Because influenza is often considered a similar disease in terms of contagion, vaccination strategy, and prevalence, we considered 2019 mortality rates and vaccination coverage as additional candidate predictor variables. The distribution of flu deaths is well-behaved, with no particular geographic pattern. We selected 2019 flu data to preclude any interactions with COVID. We used linear regressions to evaluate relationships with state-level cumulative COVID admission and mortality rates.
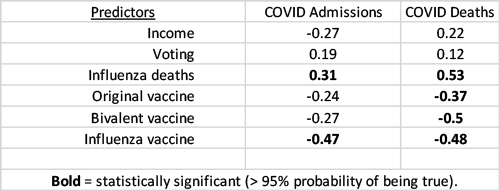 These single-factor relationships largely conform with expectations - vaccination reduced cumulative COVID outcomes. However, behavioral factors did not, contrary to some of our previous results with daily COVID rates.
But these single factors are interrelated. When considered jointly, only flu deaths remained significant. This was also the case for all other combinations of factors except the combination of flu deaths and flu vaccines, which was the best predictor of cumulative COVID deaths. The positive contribution of deaths and the negative contribution of vaccination produced an overall correlation of 0.60.[2]
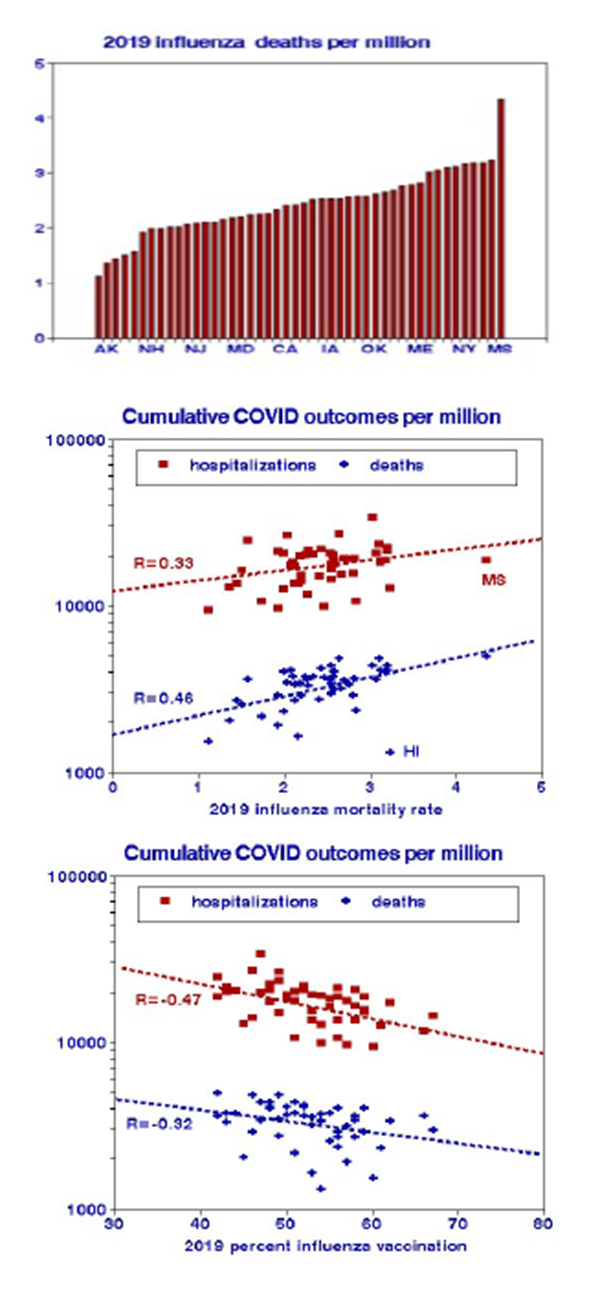 The distribution of influenza deaths is unremarkable, as shown in the bar graph. Flu deaths are the best predictor of COVID deaths, and flu vaccination is the best predictor of COVID hospital admissions, considered singly as shown in the scatter plots. Similar relationships were found with regional data.
Recognizing that these results are solely based on observations (data) and not on biology or clinical trials is essential. We are not claiming that an individual COVID victim from 2020 to 2023 also had influenza in 2019. But the populations, environments, and medical care leading to a propensity for flu in a given state in 2019 remained and led to a propensity for COVID. Our findings are a starting point for future investigations, not a fait accompli.
[1]