
I pondered two related questions:
- Is public health associated with prison incarceration rates?
- What demographic or environmental factors may be involved?
These are statistical questions but will let illustrations tell the stories rather than the overwhelming and tedious lists of numbers. Readers can reach their conclusions about significance, statistical or otherwise.
This analysis is based on the 48 contiguous states using data from statistical abstracts unless otherwise noted. We first consider “life” and “liberty,” which we define here as life expectancy at birth for 2019 and occupants of non-Federal prisons per 100,000 population in 2023.
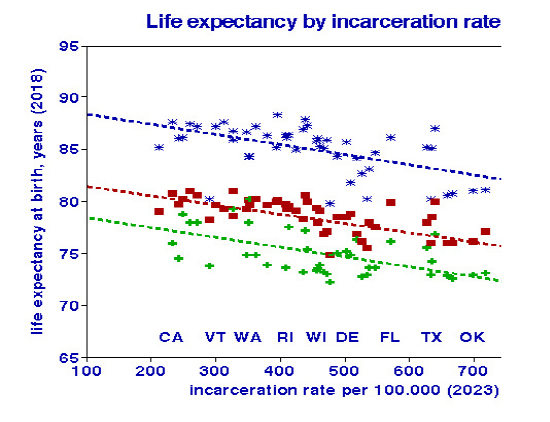 This graph contrasts life expectancies at birth[2] for three demographic groups with total incarceration rates, which vary substantially. (I labeled a few states to indicate the geographic distributions involved.) California and the Northeast have incarceration rates around 200 per 100,000 population, while rates are much higher in the South and Southwest, up to about 750. Life expectancies are closely linked with incarceration for all three groups, with similar slopes. This does not mean that deaths in prison are significant contributors to overall mortality or that opening the gates will lead to longer lives. Instead, it implies that sociodemographic factors affect life and liberty in much the same way for all three groups. The next task is to identify some of those factors, focusing on differences between Black and White incarceration rates.
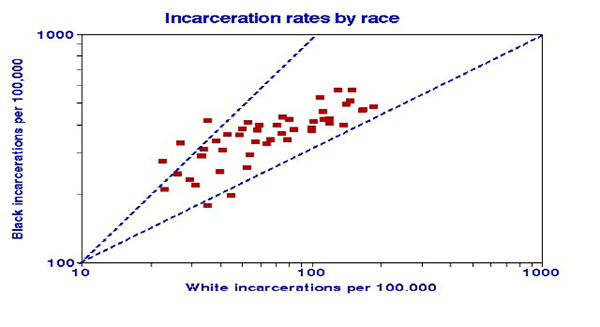
At low levels of incarceration, Blacks are imprisoned ten times more than Whites, but as the general incarceration rate rises, this disparity falls to about a 3-fold greater number of Blacks.
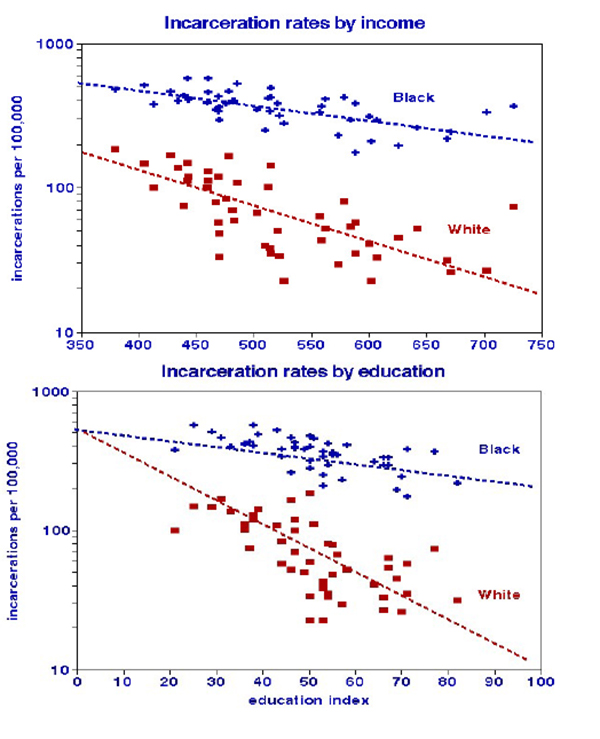
Relationships between incarcerations and statewide household income or education[3] are similar. An income difference of $40,000 would reduce White incarcerations 10-fold but only 3-fold for Blacks. The relationships with education are more striking; Blacks and Whites would suffer the same high incarceration rate without a high school or college education. Blacks appear to benefit much less from higher education, suggesting that other factors may be important.
Smoking, represented here by annual tax-paid cigarette sales, directly affects longevity but can have only indirect relationships with incarceration. This statewide measure of smoking has some advantages; it is a safe assumption that cigarettes taxed will be smoked and will comprise both active 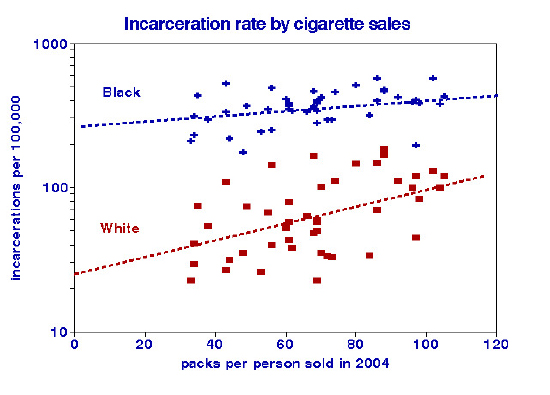 and passive health effects. The graph indicates 10-fold incarceration differences between Black and White nonsmokers. These are very modest rates of smoking; by contrast, a 2-packs-per-day smoker would have purchased 730 packs annually. These data also indicate that smoking two packs per day may have reduced life expectancy by about 15 years.
Air pollution has been blamed for a host of adverse effects ranging from crib death to dementia; I thought it might be interesting to look at relationships with incarceration. I chose two measures of particulate matter: 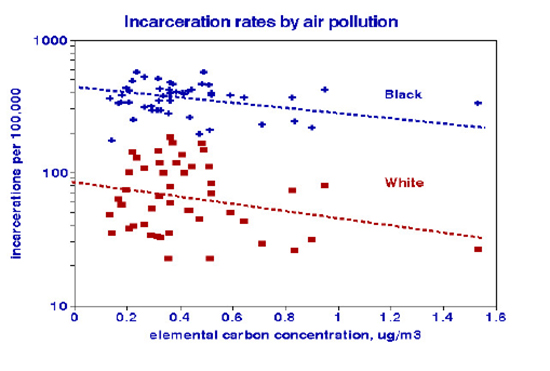 PM2.5, which includes particles of varying chemistry often associated with coal-fired power plants, and elemental carbon (soot), associated with vehicle engine exhaust. Opposite associations are seen with the two pollutants that are also better defined for Blacks than Whites. Again, these relationships are indirect; reducing PM2.5 will not reduce prison populations, nor will putting more smoky diesel engines on the road.
My takeaways
- The US is incredibly diverse; incarceration rates vary 25-fold by state and race: from 23 per 100,000 for White Californians to 570 per 100,000 for Black Louisianans. By comparison, international incarceration rates range from about 30 to over 700 per 100,000 population. We are not exceptional globally.
- US Life expectancies range from 72 y for Black West Virginians to 89 y for Asian residents of the District of Columbia, a range of 17 y. International life expectancies range from less than 66 y in parts of Africa to 85 y in Hong Kong, a range of 19 y. Adequacy and accessibility of medical care is likely a significant factor.
- We also learned (again) that correlation may not infer causality.
This analysis offers some prime examples of fallacies in epidemiology. An ecological fallacy occurs when conclusions about individuals are based on studies of groups. An exception fallacy occurs when conclusions are based on exceptional cases. The life expectancy vs. incarceration rate graph is acceptable because it compares groups, and any exceptions are shown. The charts of income and education by state may be suspect because of significant variations within states.
The devils were in the details!
[1] Hawaii and Alaska were omitted due to a lack of environmental data. We found no data on prisons in the District of Columbia.
[2] Life expectancies are based on mortality rates by age and represent the average number of years expected to accrue after a reference age, taken here as birth. They reflect deaths at all ages, not just for the elderly.
[3] I constructed an “education index” that accounts for both high school and postgraduation studies; an index value of zero corresponds to those who had neither.
Source: World Prison Population List International Centre for Prison Studies


