
Diversity
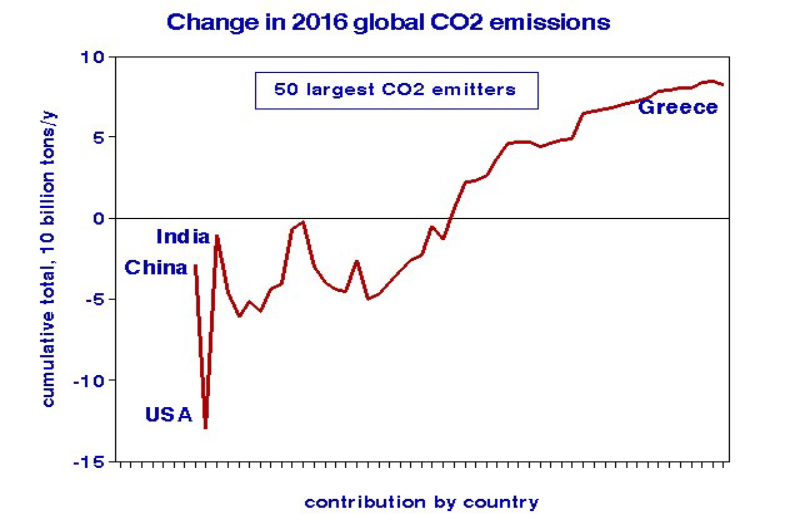
I calculated the estimated annual CO2 changes by nation for each of the top 50 emitters in 2016; these countries accounted for 91% of global emissions. I computed running cumulative changes in the worldwide total. The 2% reduction of US CO2 emissions was canceled by
- increases in 12 of the next 25 countries.
- increased emissions in 23 of the subsequent 25 countries, pushing the total global change to a net gain of 24%.
This diversity among countries completely canceled the best efforts of the US and the 12 other countries that reported decreased emissions so much for global efforts to combat climate change.
Inclusion
Despite its predominance in the media, CO2 is not the only climate-change game in town. Other greenhouse agents, such as methane (CH4), nitrous oxide (N2O), and black carbon, have been included less frequently. The effects of these agents on atmospheric heating tend to be stronger than CO2, but their estimated emission rates are much less certain. I selected methane to demonstrate the implications of inclusion in climate-change calculations.
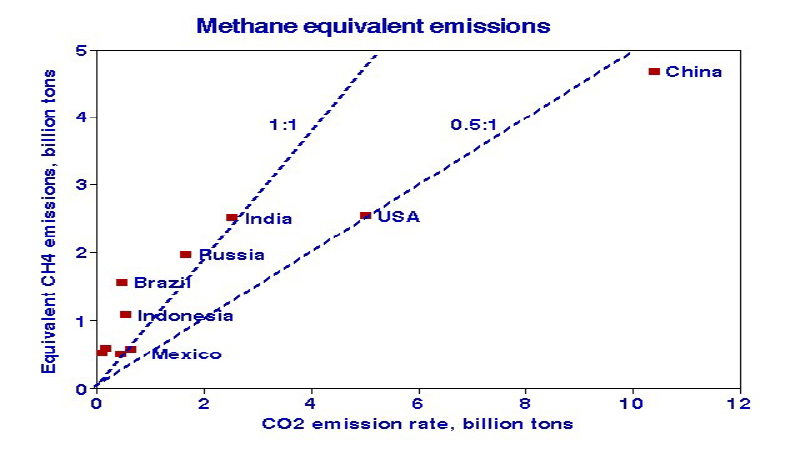
The graph compares CH4 emissions [1] with corresponding CO2 emissions. The US and China emitted methane at about half their rates of CO2; inclusion would increase their contributions to climate change by 50%. Methane emissions from other countries are about the same as their CO2 emissions, indicating that including methane would double their contributions.
It is important to consider the reliability of these emissions data. CO2 primarily results from consumption of fossil fuels and production of materials such as steel and cement; relatively reliable statistics are available for both processes. By contrast, industrial sources of methane are largely the result of losses such as pipeline leaks or flaring from oil and gas production. Reducing those emissions should thus be cost-effective and “climate-friendly.” Methane emissions are surely underestimated; we can’t count what we haven’t looked for, and natural sources of methane have not been considered here.
Limitations And Bottom Lines
Perhaps the major limitation in my analysis is the age of the CO2 data from 2016. However, my goal is to show that evaluating future progress toward limiting global climate change requires considering global emissions of all greenhouse agents. By contrast, the mission of the Intergovernmental Panel on Climate Change (IPCC) has been tasked to provide a solid scientific foundation for understanding climate change and its impacts; tracking national emission changes is also important and should be undertaken annually.
This year has seen a steady stream of potentially climate-related natural disasters, hand-wringing, and cries that the US must do more. However, when global diversity and inclusion are considered, as shown by this 2016 analysis, the residents of this planet have not yet done anything!
Why should we expect different outcomes?
[1] Methane is known to be much more effective in trapping heat than CO2 by about 80-fold. I accounted for this effect by multiplying the reported CH4 emissions by 80, which I refer to as equivalent CH4 emissions.


