
In June, we discussed air pollution dispersion as a model for virus dispersion. That paradigm is now widely accepted as a primary mode of transmission over and above transmission from contact with surfaces, for example. Additional roles of air pollution have been proposed that the putative air pollution effects on chronic disease might have enhanced the susceptibility of those infected in certain locations or that airborne pollutant particle might carry virus particles. Lacking any feasible way to test these hypotheses experimentally, I turned to geographic epidemiology for support; in this case, relationships among the contiguous states of the U.S. This cross-sectional methodology has often been used in analyzing other types of air pollution health effects [1].
Wu et al. [2] proposed that the mixture of particles classified by size known as PM2.5 was responsible for increased susceptibility to COVID-19 and used estimated air concentrations to explore relationships with the deaths reported in public databases this spring in U.S. counties. Needless to say, only a fraction of those 3000+ counties reported appreciable numbers of such deaths. Wu controlled for several potentially confounding variables but considered no other air pollutants or time periods. They reported that a single microgram of PM2.5 in a cubic meter of air was responsible for 15% of COVID-19 deaths. That finding has been picked up by the media and characterized as “huge” since it’s an order of magnitude larger than those typically reported for other causes of death [1].
I set out to test this hypothesis by studying relationships from publicly available mortality data and several potentially important independent variables and air pollutants. I compare COVID-19 relationships with population density and air pollution among states. I chose the state level because this mortality data is more stable than for counties and because COVID-19 control measures are being implemented at the state level. I found a relative risk per µg/m3 PM2.5 of 1.14 (1.02-1.27) with a correlation coefficient of 0.34, thus confirming the statistical finding of Wu et al. [2].
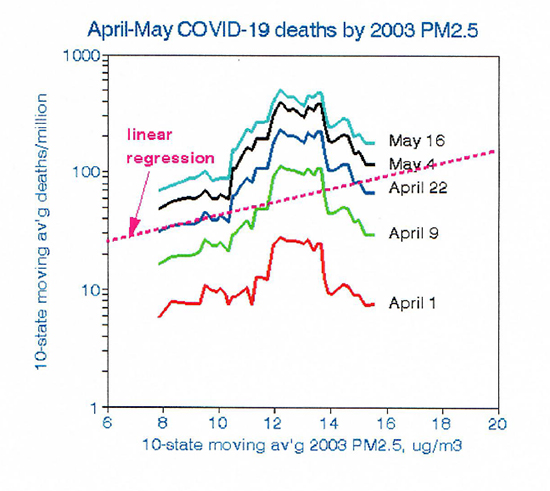 However, there is much more to this story. This first graph illustrates the need to explore the details of putative dose-response relationships rather than relying on statistical significance alone. The consistent jagged lines show how the relationships of death rates among states and PM2.5 varied over time as those deaths accumulated. The parallel trend lines clearly display a consistent non-linear relationship with the highest COVID-19 mortality rates occurring at the midlevel PM2.5 concentrations currently found in major cities of the Northeast. In contrast, the highest PM2.5 levels are found in the Midwest, where COVID-19 mortality is lower. Note that using 2003 PM2.5 data allows time for the chronic conditions thought to have increased susceptibility to COVID-19 to develop, as proposed by Wu.
I then considered other potentially important factors. Population density is a marker for virus transmissibility, such as crowded living quarters or use of mass transit. However, it is difficult to define for states because of 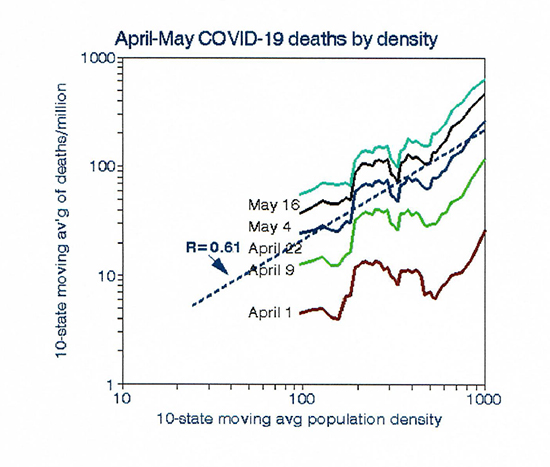 large rural areas with few residents. I used two alternative metrics, one defined by counties and the other by metropolitan areas; the results were very similar. The graph on the right shows the relationship with population density, which is much stronger than that for PM2.5. For example, assuming that all of these relationships are causal, moving from say New Jersey to North Carolina might reduce PM2.5 exposure by about 0.2 µg/m3 with a risk reduction of 3%, but the effect on risk of reduced population density would be a factor of 6 (600%).
Next, I considered other air pollutants. Klompas et al. [3] noted the strong effects of particle size, notably the smallest ones that might carry the virus. Ambient data on particles smaller 2.5 microns are scarce, but I used a database from a previous project [1] that includes elemental carbon (EC), which typically is an order of 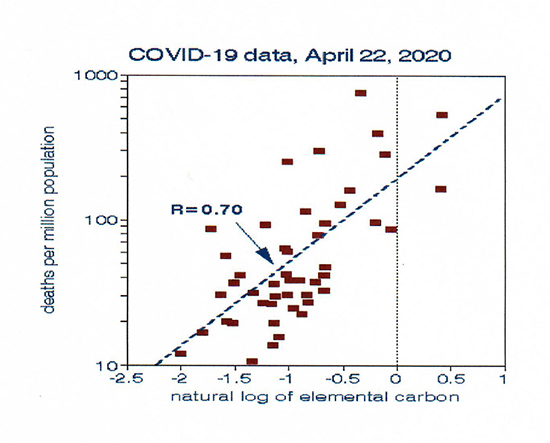 magnitude smaller than PM2.5. Those tiny particles, emitted by traffic, serve as an indicator of urban density. The final graph shows how well EC predicts COVID-19 mortality rates for individual states. Following our example above, moving from New Jersey to North Carolina would reduce EC-based COVID-19 mortality risk by a factor of 4.6 (460%). I chose individual data points here rather than the smoothed trend lines in Figures 1 and 2 to illustrate the coherence of the data. EC might fit the COVID-19 mortality data better than population density because of the inherent difficulty in defining a density for a state with both large urban and rural areas.
There are several lessons to be learned here. The first is the need for a viable physiological mechanism before embarking on an epidemiological fishing expedition. Wu hypothesized that prior studies showed long-term associations of PM2.5 with other (chronic) diseases. However, such causality has not been established experimentally, and that hypothesis is not universally accepted outside the walls of academe. Perhaps, more importantly, is the need to understand and visualize the data before fitting arbitrary models to them. I conclude from my analysis that COVID-19 mortality was higher in densely populated locations where PM2.5 is not at issue but that specific causal factors for COVID-19 mortality have yet to be identified. PM2.5 is not likely to be among them.
[1] Air pollution and survival within the Washington University - EPRI Veterans Cohort: risks based on modeled estimates of ambient levels of hazardous and criteria air pollutants. J Air Waste Manag Assoc. PMID: 19418821
[2] Exposure to air pollution and COVID-19 mortality in the United States: A nationwide cross-sectional study MedRxiv DOI: 10.1101/2020.04.05.20054502.
[3] Airborne Transmission of SARS-CoV-2: Theoretical Considerations and Available Evidence. JAMA. DOI: 10.1001/jama.2020.12458.


