
Fred Lipfert, Ph.D., and Sheldon Lipsky
There are over 8000 scientific papers on COVID-19 and the United States, over a fourth involving epidemiology, but only one mentions cross-sectional analysis, the traditional method of examining geographic differences. We set out to do such an analysis using publicly available data [Data can be found here and here], comparing the differences among New York City zip-codes and the various small cities surrounding Los Angeles (in place of data on COVID-19 by zip-code there). We chose New York City and Los Angeles because they are major metropolitan areas with very different social cultures.
Notwithstanding the unprecedented transparency of the COVID-19 outcome data, much of the relevant data concerning income, education, and living conditions must be inferred from residential locations. The underlying assumption is that wealth and education travel together, just as poverty travels with a lack of education. This so-called ecological assumption (and fallacy) assigns properties to individuals based upon group averages. The assumption’s validity is strongly dependent on the size of the group, where smaller groups are more homogenous and large groupings less so. Small cities or zip codes utilize smaller, more homogenous groups of about 50,000 with census records providing the necessary details [1,2]. We considered income, education, overall residential density, and individual living conditions as indicated by persons-per-household. Many studies have linked income with access to appropriate medical care and educational level, to adherence with social distancing and personal protection guidelines, and to employment that entails more significant inadvertent contacts with infected persons. We used graphical and statistical methods to analyze cumulative numbers of COVID-19 cases and subsequent deaths up through late August.
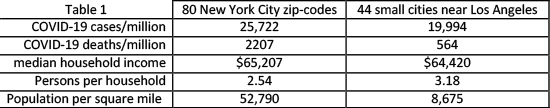
Table 1 describes the overall conditions in the two communities. There are both important similarities (total COVID-19 cases, mean income, persons per room), and differences (total COVID-19 deaths, population density). Our ongoing state- and county-level analyses find strong adverse associations with population density.
Figure 1 shows the accumulation of cases and deaths for the two cities. The New York City trajectory of cases 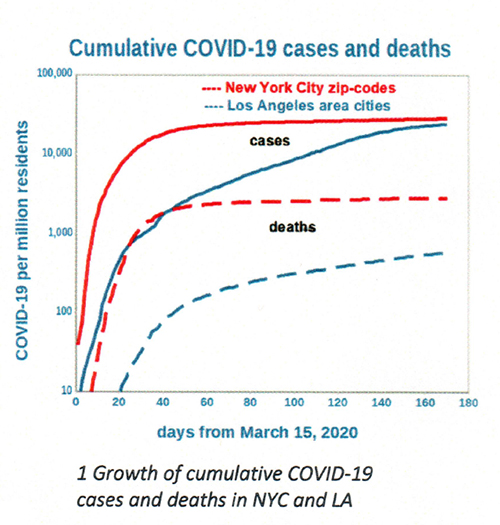 and fatalities initially increased rapidly, cases doubling about every two days before leveling off (“flattening”) in May. By contrast, the Los Angeles trajectory of deaths continued to increase, albeit at a slower pace. Perhaps most noteworthy is the increasing ratio of cases to fatalities in Los Angeles, from about 14 originally to about 50 currently. This ratio was relatively steady at about 10 in New York City. The steady increase in Los Angeles cases brought its total to within range of that in New York City.
We found that household income and persons-per-household were the strongest predictors of COVID-19 variations among the zip-codes and cities. Figure 2 depicts these relationships, for which the two sets of data are quite similar in terms of slopes and intercepts, especially for cases. The two relationships for deaths are parallel but offset by an order 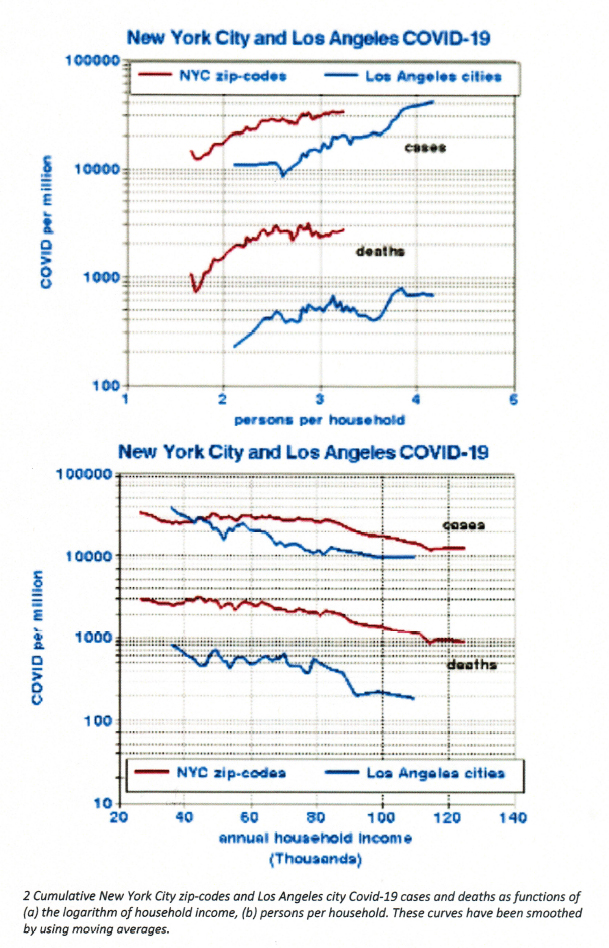 of magnitude, indicating that COVID-19 may be much more lethal in New York City. We used logarithmic scales because of the wide ranges of these quantities (up to 3 orders of magnitude).
Using multiple and single regression analysis, we found that both income and persons-per-household are useful predictors of COVID-19. We found that the regression coefficients for New York City and Los Angeles did not differ within their confidence limits, implying that these estimates might be valid for other locations. Our results indicate that, on average, each additional person in the household increases COVID-19 risks by about 50% and that doubling household income would decrease risk by about 60%. (“Your results may vary.”)
Limitations
However, other factors must be considered, as in all such observational studies. First, is there independent support for these putative relationships? Our response to this question is “yes.” Income implies socioeconomic status and may be a marker for access to medical care or compliance with recommended exposure avoidance. Persons-per-household suggests potential exposure to individuals who may be asymptomatic carriers of the virus.
Next, are there other variables or factors that may have confounded these relationships? Census data are extensive and far-reaching so that the list of possible confounders may be virtually infinite. However, invoking the first condition narrows those possibilities. We considered overall population density, educational attainment, and race. We found that those factors did not improve the degree of correlation, suggesting that living conditions may be more important than ethnicity. Note that population density tends to be a favorable factor in New York City, where the affluent may choose to live in dense, high-rise buildings. We have no data on pre-existing conditions or on the age distributions of the infected individuals that could comprise uncontrolled confounders.
As with any good study, more questions than answers emerge. Why is COVID-!9 apparently so much more lethal in New York City? The mean cases per million residents are similar in both cities, but there are roughly four times as many deaths in New York City, where population density is six times higher. Possible hypotheses include different strains of the virus, transmission from New York to the rest of the country with attenuation or mutation, differences in traffic density, differences in underlying health status, age, or medical care. Answers to these questions are essential but remain elusive.
What can be inferred from this project? Factors within metropolitan areas describing residents differ from those between areas that describe their geography. Trends in COVID-19 deaths may not follow those for infections (cases). The ready availability and transparency of public health data serve to broaden the range of techniques used to improve understanding of this disease.
[1] Wolframalpha
[2] Gaquin DA, Ryan MM. 2015 County and City Extra. Annual Metro, City, and County Data Book, 23rd edition. Berman Press
Sheldon Lipsky received an MSEE degree and worked as a consultant on electronic systems for national defense projects and designing of control systems. Since retiring, he has taken an interest mentoring college and high school students in data handling techniques and robotics


