
The Centers for Disease Control (CDC) warns us to maintain 6-ft social distancing and avoid crowds, especially indoors. These guidelines have often morphed into fear of turning family gatherings during holidays into super-spreader events that could involve additional COVID risks. The medical literature provides no help beyond that of the CDC, along with an anecdotal reporton viral transmission at a specific family gathering and the speculative risk of encountering Santa Claus. Figure 1 shows national cases and deaths reported for each day since March 2020 [1]. Case-fatality rates (CFRs) are based on the ratio of deaths to cases 21 days previously.
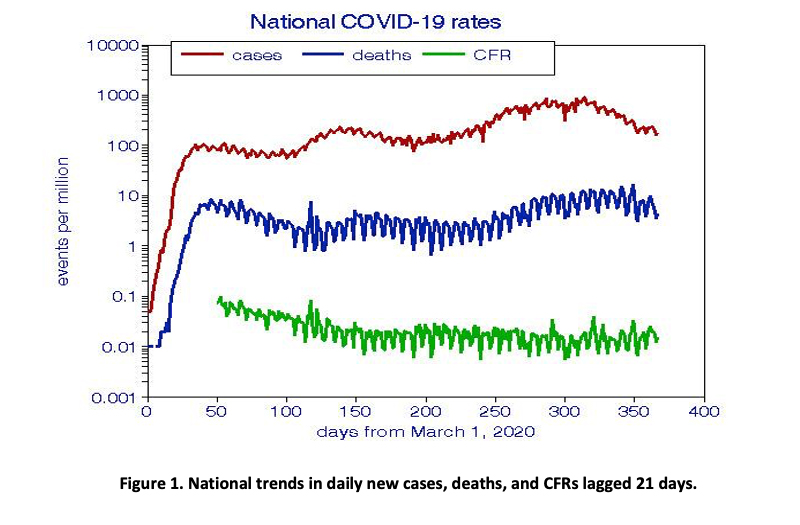
National trends.
The first observation from Figure 1 is systematic variations among the 365 data points.
- Case trends show three cycles or “waves” peaking in May, August, and December and showing increasing peaks and durations over time. These cycles do not appear to be seasonal, nor do regional trends. Cases show gradually increasing baseline risk levels from which these waves depart, less so for deaths. They show no positive spikes but several negative ones, of which the most recent three occurred during holiday periods, as discussed in more detail below.
- Daily deaths also exhibit long-term wave patterns.
- CFRs are essentially flat since mid-August at about 1% if lagged to account for hospitalization before death, but not otherwise. There is a slight recent uptick in CFRs that can be sensitive to the assumed length of hospitalization before death.

Figure 2 displays how the weekday deaths changed over time, increasing from about a factor of 2 to a factor of 3 during the pandemic. Delays in death reporting are common, especially on weekends, explaining the variations on Sundays and Mondays rather than on Saturdays and Sundays. However, it is difficult to rationalize the apparent distribution of delayed deaths over the other weekdays but explains the apparent media preference for 7-d moving or weekly averages. 
Holiday periods - a 2% "excess"
According to the media, COVID-19 infections were expected to increase after major holidays because of added transmission during family gatherings. We analyzed the case data from November through January to investigate this hypothesis in more detail (Figure 3).
We included a quadratic curve fit to indicate the trend during this period which is nonlinear, concave downward around the holiday period. It is a very good fit to the actual data, and the points above and below the curve reflect the daily deviations.
- There are modest increases in the three weeks before, between, and after Thanksgiving and New Year’s
- Steep rises from excess cases over ~5 days after the holidays.
- Case rates plunged on the actual holidays, presumably because of reduced testing activity.
- We found no such patterns for Easter, Memorial Day, Independence Day, or Labor Day when social movement was more limited.
There is a fundamental difference in measuring the daily deviations in cases and deaths. Dead is dead, and the total body count will eventually be correct. However, the number of confirmed cases is sensitive to the number of tests performed, which would be expected to remain essentially constant from day to day when averaged. Since Figure 3 is based on national averages, the lower case counts most likely represent systematically missed testing opportunities due to the holidays rather than random variations – the trend line would more likely reflect the actual national infection rates.
By contrast, a peak in the recorded national case count relative to expectations is likely to reflect an actual increase in national positivity such as might have resulted from increased exposure and transmission during a holiday period, for the same reason: national data cannot reflect local random variations.
Any daily holiday excess is the difference between observed cases and the trend line cases. Summed over the 50-day holiday period, we estimated 1600 extra cases per million population. Throughout the pandemic, the total US burden is 86769 cases per million. Without the holidays, the total would be 85170, or 98.2%. This is the basis for our conclusion that holiday effects, although detectable, are not important from a public health perspective. The total holiday excess in Figure 3 would thus be about 2% of the annual total.
Conclusions.
We conclude that actual dates of COVID-19 deaths cannot be determined precisely, making weekly periods the smallest practical mortality time scale. It appears that 7-day averaging may mask not only randomness but also systematic variations in the recorded data. We see consistent perturbations in infection trends for which reductions likely reflect reduced testing, but positive spikes are likely to indicate increased virus transmission. Nevertheless, holiday gatherings do not appear to exert significant long-term increases in COVID-19 infections or fatalities.
[1] Github Database