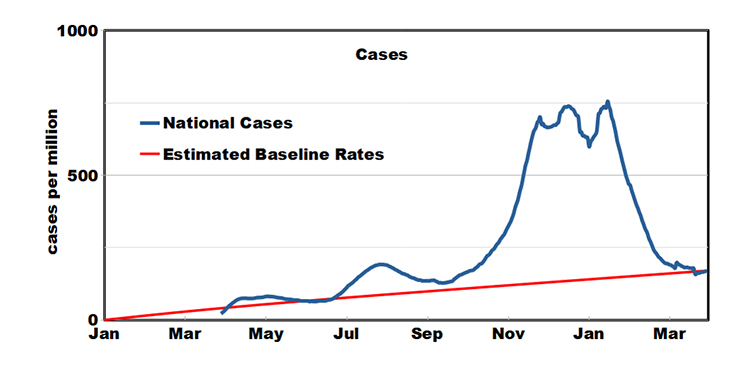
This plot shows the growth of daily new COVID-19 cases since March 2020 with 3 “waves” and the possible beginning of a 4th. The red line is the trend created by the virus spreading throughout the nation and represents the nation's baseline growth rate of about 5,000 cases per month. The baseline values are similar to the lowest seen among large cities. Retroactive extrapolation sets the beginning of the pandemic at about January 1, 2020, which is realistic. The peaks increase over time because they multiply the baseline values through exponential growth.
The ratios of successive peak daily cases are approximately 2.3 and 4.5, which may seem excessive. However, variations in these rates of infection among race or ethnic groups range by factors 2-4, and the range in average cases among states at the end of March 2021 exceeds an order of magnitude. The transmission capability of COVID-19 should not be underestimated.
For a given exposure, the virus first takes the weakest victims, some of which were frail due to comorbidity and aging. The supply of “susceptibles” increases slowly but steadily (as seen by the baseline growth rate), and COVID-19 infection occurs when viral load overcomes immunologic resistance.
Over time, the susceptibles are depleted; mask and social distancing increase at the urging of public health officials, and the surge subsides. However, the supply of potential victims continues to grow, as does the public's reluctance to continue adherence to guidelines; the wave recurs. While vaccinations will diminish the supply of susceptibles, new and more transmissible coronavirus variants may create additional surges of infection. The future course of the disease remains uncertain.