
During London’s Great Smog, daily deaths rose by an order of magnitude and continued for about two weeks once the skies cleared. Autopsied lungs showed heavy deposits of carbonaceous material, leaving little doubt that air pollution was at least partly to blame. Since then, epidemiologists have tracked daily records around the world searching for relationships with various pollutants.
Time-series studies.
These studies compared the daily rise and fall of deaths and air pollution concentrations, using regression analysis to identify matches after adjusting for temperature cycles and days of the week. Rather than focusing on a single major event like the London fog, they look for patterns among small perturbations over years. These time-series analyses are intended to describe responses following a given event at a particular place. Air pollution-related deaths are customarily referred to as “excess,” i.e., greater than expected for that time and location.
Time-series analyses must consider several issues:
- The causes of deaths and pollutants to consider, either singly or in combination
- How to best account for seasonal variation and confounding by daily weather changes, primarily temperature
- How many succeeding days (lags) are required to account for delayed deaths
- How to compare risks associated with different pollutants.
Both causes of deaths and choice of pollutants depend upon the available data. All-cause mortality is the most comprehensive, but the pollutants monitored for regulatory purposes are the only ones considered consistently. While confounding by seasonal trends and climate changes have been addressed statistically, the periods of “delayed deaths” and the comparative risks of pollutants remain unsettled.
Lag effects.
The 1952 fog episode showed lingering effects, representing individuals who survived the initial respiratory stress but succumbed later. Over the years, questions arose about whether such daily mortality relationships persisted at much lower air pollutant concentrations and included delayed responses.
It is axiomatic that no excess death can occur before a pollution event. Some people will die on the day of the event, more on the next day, and still more on succeeding days. The total mortality “yield” associated with a pollution event is the sum of all excess deaths during the lag period – as the lag period increases, so do the death counts.
Typically, the researcher defines their lag interval based upon the most statistically significant lag periods in their regression analyses to represent overall mortality. But that choice reflects a selection bias (cherry-picking), and there is no accepted standard. Since most studies have selected the day with the highest response and the following day, the actual excess daily risks remain unknown.
Representation of air pollution risks.
Air pollution health effects from epidemiological studies have usually been presented in terms of arbitrary concentration increments such as parts per billion (ppb) or micrograms per cubic meter (10μg/m3). Such increments are helpful for regulatory purposes such as compliance with ambient standards, but they are less useful for scientific purposes. For example, since the US national average PM2.5 level is 8 μg/m3, an increment of 10 μg/m3 has a very different connotation than a ten ppb increase in ozone over its typical ambient level of 60 ppb. Here I express risks as if the pollutant was totally eliminated.
Reconsideration of selected studies.
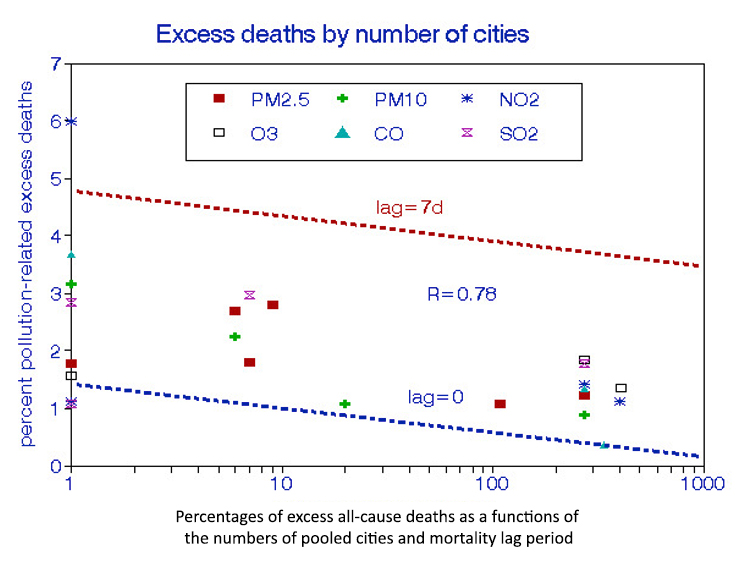 I retrieved thirteen daily mortality studies [1] from PubMed that presented all-cause mortality risks associated with any of 6 regulated air pollutants. The numbers of pooled cities ranged from 1 to 406. The figure shows mortality risks decreasing with the number of pooled cities and increasing with lag days. The excess deaths attributable to each pollutant ranged from 1.79% to 2.41%, with a mean of 2.22% overall. Accounting for lag effects could triple these estimates.
PM2.5 PM10 NO2 O3 CO SO2
1.90 (0.27) 1.84 (0.46) 2.41 (1.03) 3.24 (1.43) 1.79 (0.80) 2.17 (0.39)
There are no significant differences among these risk estimates
Interpretations
The results of these studies imply that brief exposures to modest concentration levels can be lethal to about 5% of the population at risk, defined as those who died from all causes. Most studies consider this subpopulation as those aged 65 or over, whose annual mortality rate is also about 5%. Thus, these premature pollution-related deaths would comprise about 0.3% of the elderly population; it stands to reason that this subgroup would include the frailest individuals within the population. Indeed, such susceptibility is a definition of “frailty.” Other studies [2,3] have shown that exposure to various air pollutants might have cut such individuals’ lives short by only a few days. This time-dependent concept has nothing to do with air pollution as a cause of chronic disease, as has been assumed by WHO.
Conclusions and Implications
There is no apparent merit in pooling large numbers of cities in a time-series analysis. More might be gained by studying the differences among cities after accounting for socioeconomic disparities. However, my findings depend on a few observations and should be confirmed by additional studies. Future time-series studies should sum risk estimates over lag periods of at least a week and include several pollutants to be compared based on their mean concentrations.
[1] Air pollution and daily mortality in London: 1987-92. BMJ. DOI: 10.1136/bmj.312.7032.665
Fine Particulate Air Pollution and Daily Mortality. A Nationwide Analysis in 272 Chinese Cities. Am J Respiratory Critical Care Medicine. DOI: 10.1164/rccm.201609-1862OC.
Ambient carbon monoxide and daily mortality: a global time-series study in 337 cities. Lancet Planet Health. DOI: 10.1016/S2542-5196(21)00026-7.
Associations between Coarse Particulate Matter Air Pollution and Cause-Specific Mortality: A Nationwide Analysis in 272 Chinese Cities. Environ Health Perspectives. DOI: 10.1289/EHP2711.
The National Morbidity, Mortality, and Air Pollution Study. Part III: PM10 concentration-response curves and thresholds for the 20 largest US cities. Research Reports Health Effects Institute.
Short term associations of ambient nitrogen dioxide with daily total, cardiovascular, and respiratory mortality: multilocation analysis in 398 cities. BMJ. DOI: 10.1136/BMJ.n534.
Time-series analyses of air pollution and mortality in the United States: a subsampling approach. Environmental Health Perspectives DOI: 10.1289/ehp.1104507.
Fine particulate air pollution and mortality in nine California counties: results from CALFINE. Environmental Health Perspectives DOI: 10.1289/ehp.8335.
Investigating regional differences in short-term effects of air pollution on daily mortality in the APHEA project: a sensitivity analysis for controlling long-term trends and seasonality. Environmental Health Perspectives. DOI:10.1289/ehp.01109349.
Short-term association between ozone and mortality: global two-stage time-series study in 406 locations in 20 countries. BMJ. DOI: 10.1136/BMJ.m108.
Associations between short-term exposure to ambient sulfur dioxide and increased cause-specific mortality in 272 Chinese cities. Environment International DOI: 10.1016/j.envint.2018.04.019.
Ambient Ozone Pollution and Daily Mortality: A Nationwide Study in 272 Chinese Cities. Environmental Health Perspectives DOI: 10.1289/EHP1849.
Short-term effects of particulate matter on cause specific mortality: effects of lags and modification by city characteristics. Occupational and Environmental Med. DOI: 10.1136/oem.2004.017012.
[2] Inferring frail life expectancies in Chicago from daily fluctuations in elderly mortality. Inhalation Toxicology DOI: 10.3109/08958378.2013.804610.
[3] Air pollution, mortality, at-risk population, new entry, and life expectancy of the frail elderly in three US cities. Studies Nonlinear Dynamics DOI: 10.1515/snde-2019-0098


