
Perhaps that last line is a bit of self-reflection, and "we" is just me. I was already sensitized to the issue of life expectancy by the latest book by Steven Johnson Extra Life (which I heartily recommend) that discusses the advances that have doubled our life expectancy in roughly the last 100 years. The two reported studies offered me and perhaps you an opportunity to understand better the information quantified by life expectancy.
The Studies
COVID-19 rocketed to the 3rd leading cause of death in the US last year, and up to this point, the US has had the greatest number of deaths globally. The first study, reported by the BMJ, placed the decrease in life expectancy at “1.87 years (to 76.87).” In JAMA Network Open, the second reported a reduction of “1.31 years from 78.74 years to 77.43 years.” And both studies report greater decreases in life expectancy when considering Blacks and Hispanics. This infographic sums it up nicely.
What is Life Expectancy?
Most importantly, life expectancy is a snapshot of the population at a point in time; it doesn’t tell us anything about how long we will live. Life expectancy tells us “the average age of death in a population.” It is a frequently cited measure of a population’s overall health measuring "premature" deaths. The changing value is meant to describe the excess deaths due to the COVID-19 pandemic.
Calculating Life Expectancy
You can calculate this life expectancy in one of two ways. You can follow a group of individuals, a cohort, from their birth to their death and calculate the average. This “cohort” life expectancy is very accurate, but it only works for historical data. You have to wait until everyone in the cohort has died; life expectancy based upon a cohort is not typically reported.
The two recently reported studies calculate the more frequently cited “period” life expectancy. During a given period, in this case, 2020, the population is stratified into five-year groupings by age; the death rates are taken from national statistics, weighted by the size of the group, and averaged. [1] The two calculation methods give you differing numbers; one is no better than the other, each provides different images of similar “coins.”
The calculations have inherent bias and limitations. The most straightforward example is infant mortality, which has been one of the most significant drivers in our increasing life expectancy. It has an outsized role in the calculation; the fewer babies surviving early, the fewer the number of individuals that can raise our average life expectancy. Similarly, the effect of adding an additional year of life to the elderly, say through cancer treatment, has less impact because there are fewer of the elderly being impacted.
Some context
On the face of it, the findings of the studies showing a two-year loss of life expectancy overall and a nearly four-year loss among Hispanics seems large and captured headlines. It would be helpful if there were another event like COVID-19 to use as a comparator, and there is, the Spanish Flu of 1918 [2]. The graphic from Our World in Data captures that change in life expectancy.
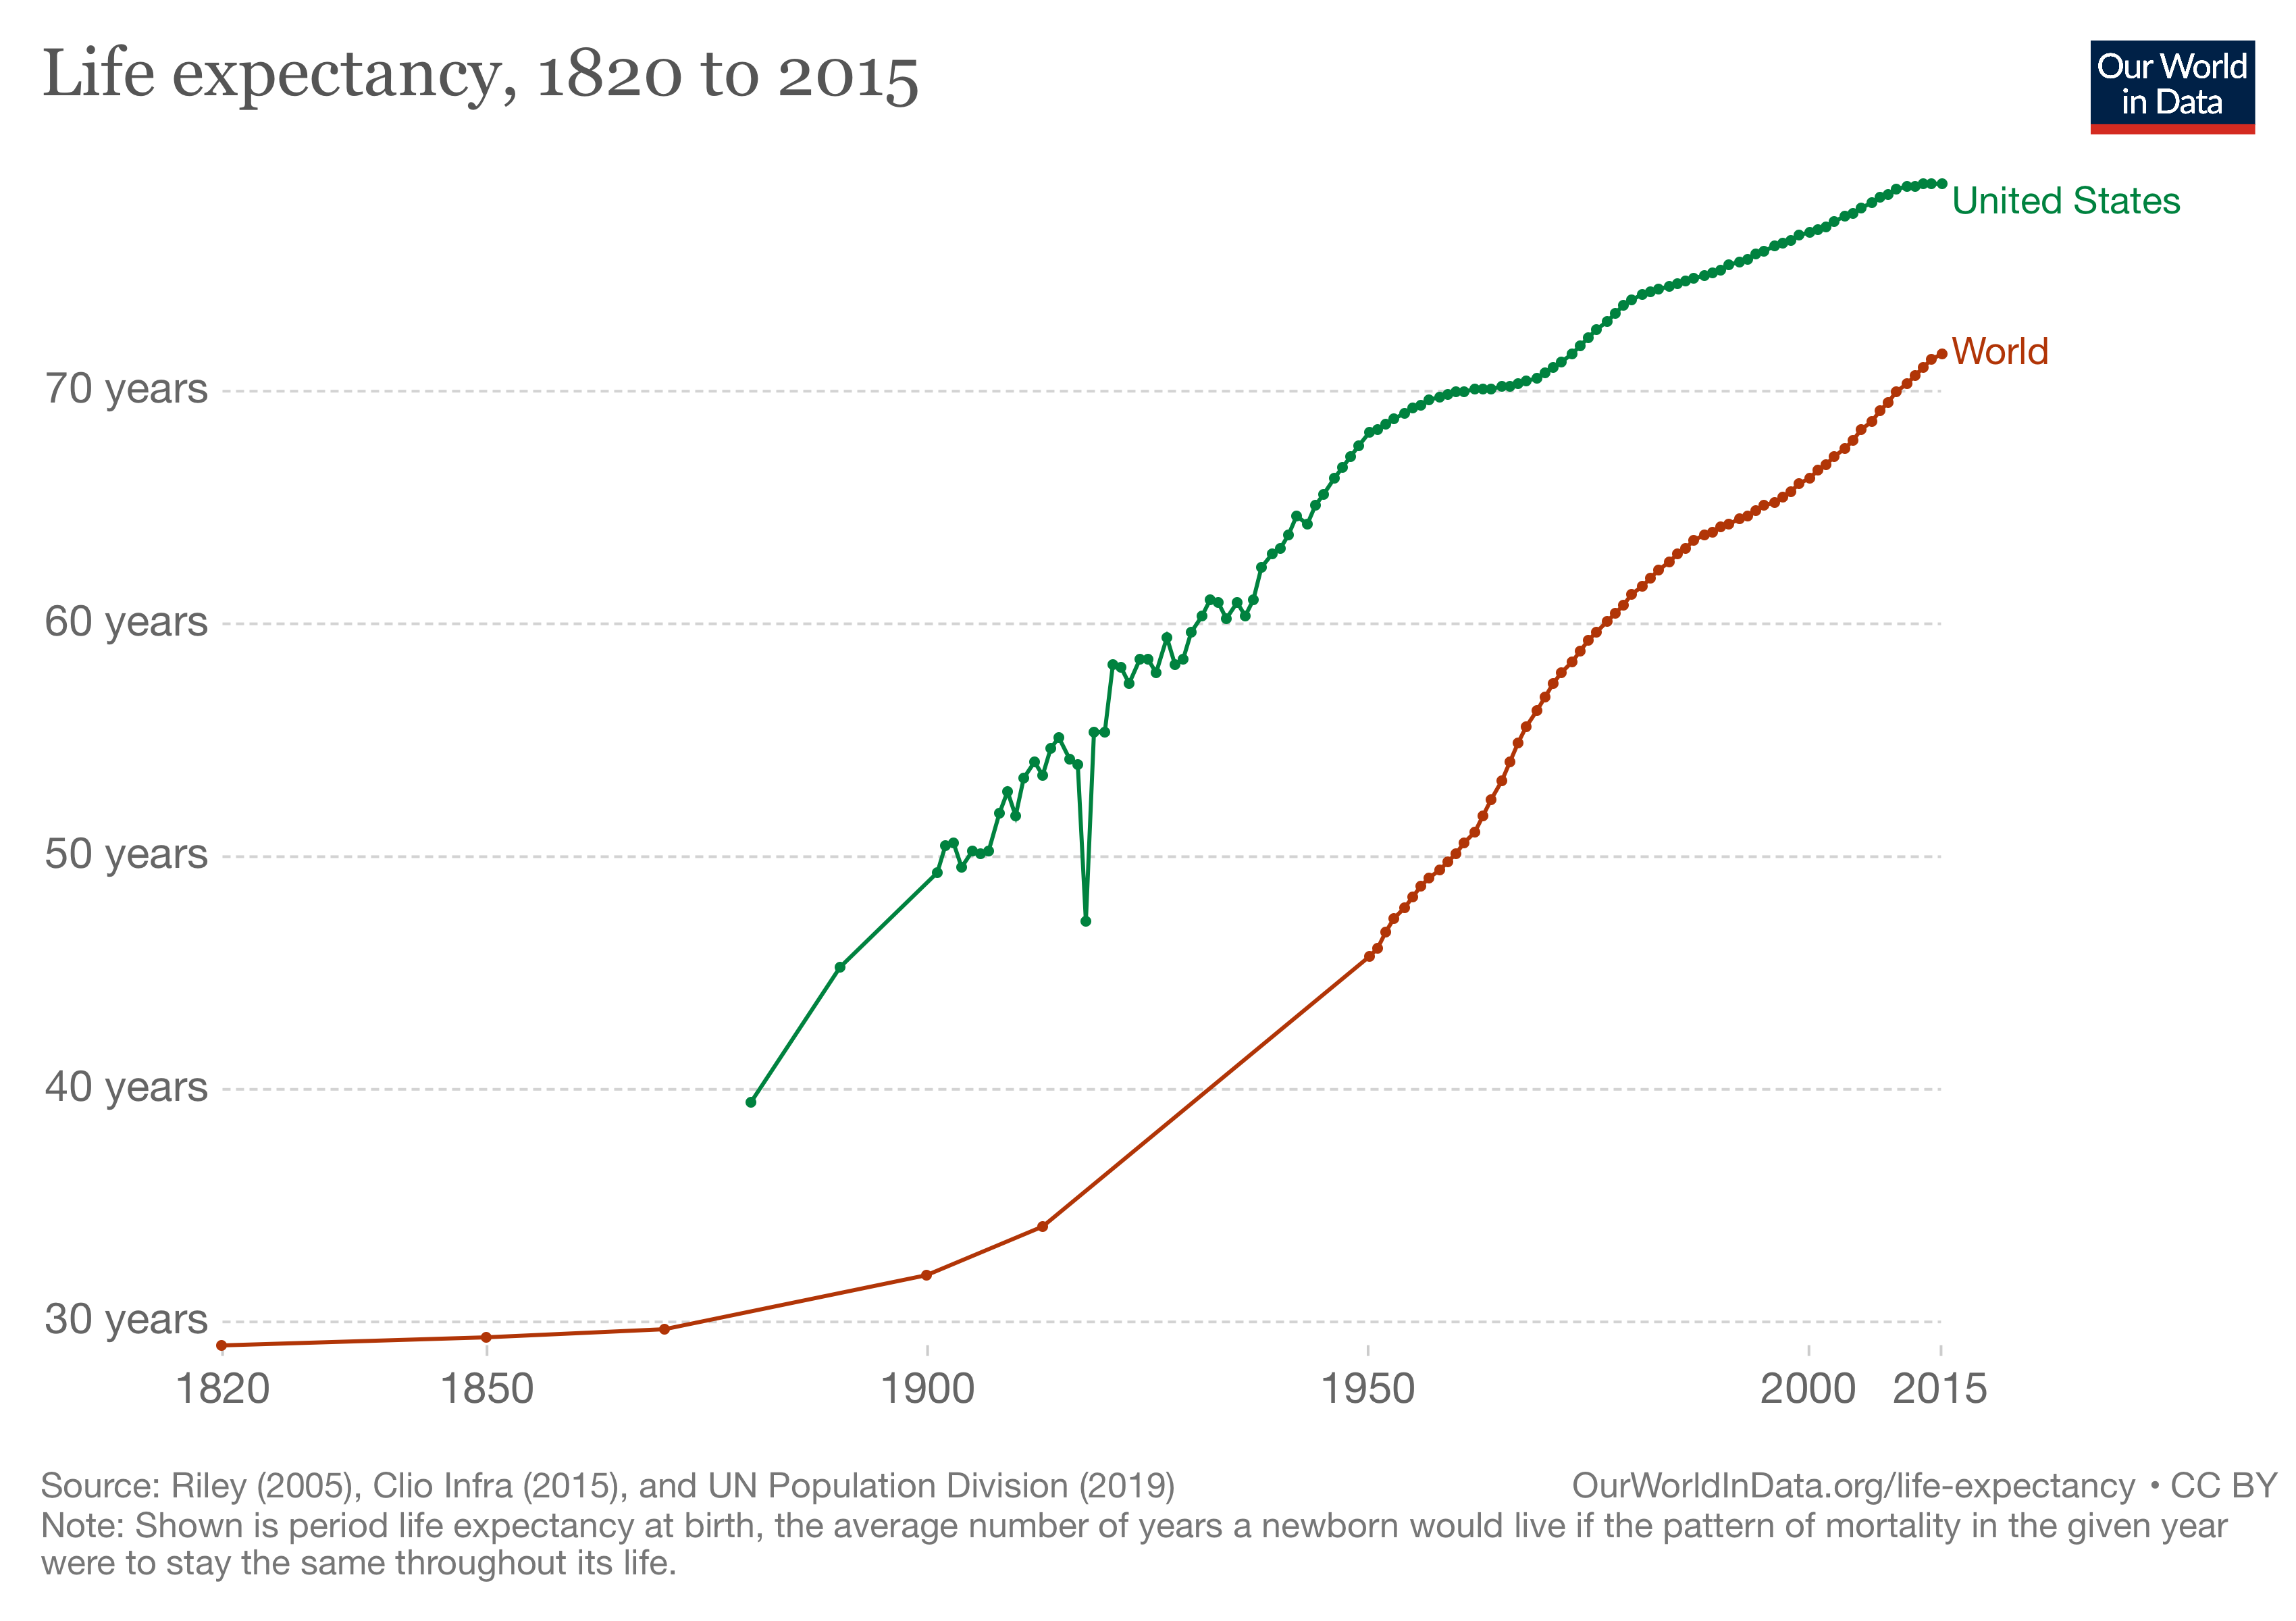
In the US overall, the Influenza Pandemic of 1918 decreased life expectancy by over six years, from 54 to 47.6 years of age, three-fold our current loss. Based upon our increased lifespan, COVID-19 reduced our life expectancy by about 1.6%, Spanish flu by 11.8%
What caused the decrease?
Period life expectancy's underlying assumption is that something happening in the internal, a “period factors,” in this case COVID-19, cause the immediate impact. For 2020 that is overwhelmingly the case, but other period factors contribute. There are the ongoing deaths of "despair" from our “opioid” crisis and deaths from care not received for other conditions like cancer or heart disease when COVID-19 shifted our healthcare focus.
That said, other less considered factors are playing a role.
Not all members of the population are equally susceptible to dying in these cases from COVID-19. This reflects the heterogeneity of the population. COVID-19 has characteristically taken the old, not the young or younger. As it turns out, the US has quite a few frail if we consider those still alive with significant co-morbidities or disabilities. Again, a graphic from Our World in Data.
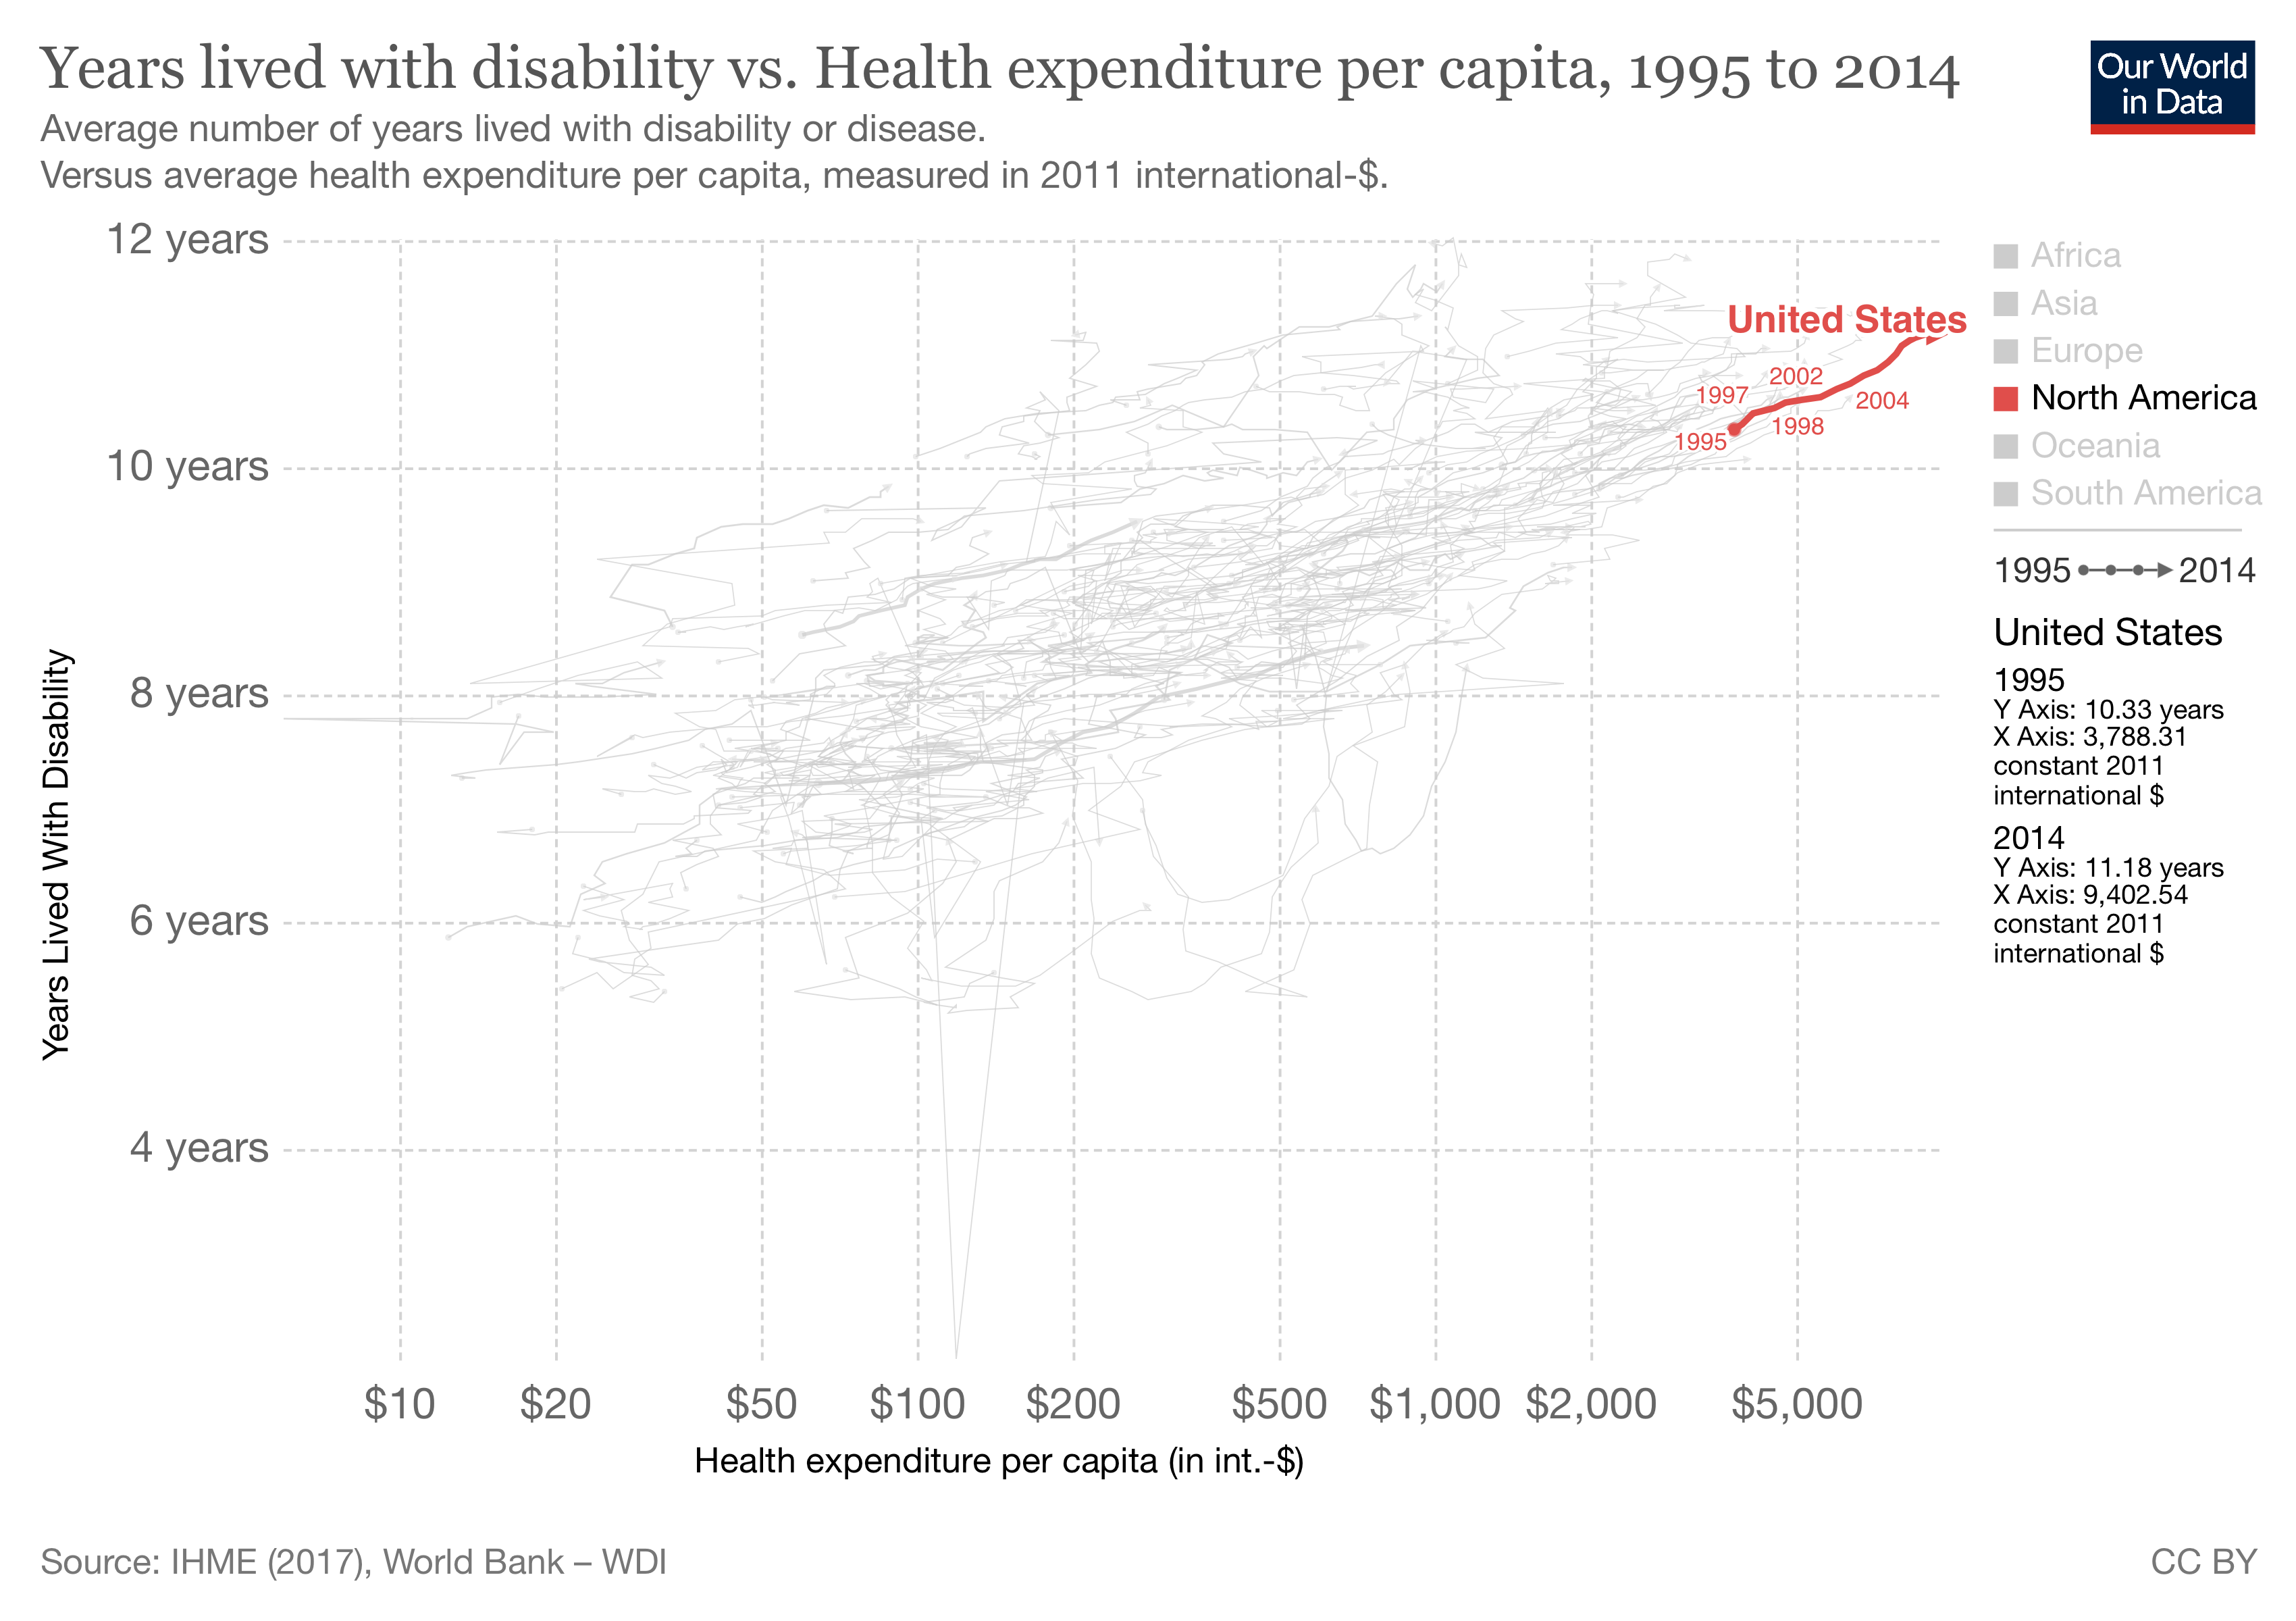 We are global leaders in keeping our frail alive. (That may explain some of our disproportionate healthcare costs, but I digress) In epidemiological terms, our excess frail with their high case fatality rates are “harvesting effects” as COVID-19 clears the frail and elderly, much as a wildfire might clear brush that is fueling the fire. A secondary effect of the harvesting is that there will be fewer frail to “harvest” in subsequent periods. There are more spry survivors, which would allow the life expectancy to rise without any other cause.
Similarly, there can be tempo effects, where shifting death rates, in this instance due to vaccines and better care for those hospitalized, alter deaths over time - altering life expectancy calculations by reducing the numerator of dead and increasing the denominator of survivors.
A second factor is the effects on the survivors. COVID-19 has this cohort effect, Long COVID. We know little about its underlying etiology, although we and other sources have reported it may be related to a reactivation of the Epstein-Barr virus that most of us carry asymptomatically. But we know even less about the long-term consequences of Long COVID and whether it may deleteriously impact one’s health and, in turn, our calculated life expectancy. The effect of COVID-19 on period life expectancy will continue for some time.
Life expectancy is a means of quantifying our changing health, but it is an imperfect measure. Understanding the heterogeneity and cohort effects that alter its calculated values gives us a better perspective on its meaning, making us more scientifically literate citizens.
[1] Life expectancy is calculated by counting age-specific deaths and dividing by the total age-specific population alive at a given time point. With fractions of deaths per age group, we can calculate “a “life table” showing the evolving probabilities of survival and the corresponding life expectancies by age.”
[2] Just as a historical aside, the influenza pandemic of 1918 began in Kansas, and our soldiers brought it around the world during their World War I deployment. Censors did not want to impact wartime morale and refused to report the pandemic. Neutral Spain could and did publish accounts, hence the name. Perhaps as we rightfully cast a concerned eye towards China and its role in COVID-19, we should remember our role in 1918.
Sources: Effect of the covid-19 pandemic in 2020 on life expectancy across populations in the USA and other high income countries: simulations of provisional mortality data BMJ DOI: 10.1136/bmj.n1343
Association of the COVID-19 Pandemic With Estimated Life Expectancy by Race/Ethnicity in the United States, 2020JAMA Network Open DOI:10.1001/jamanetworkopen.2021.14520
Life Expectancy: Frequently Used, but Hardly Understood Gerontology DOI: 10.1159/000500955

Chuck Dinerstein, MD, MBA
Director of Medicine
Dr. Charles Dinerstein, M.D., MBA, FACS is Director of Medicine at the American Council on Science and Health. He has over 25 years of experience as a vascular surgeon.


