
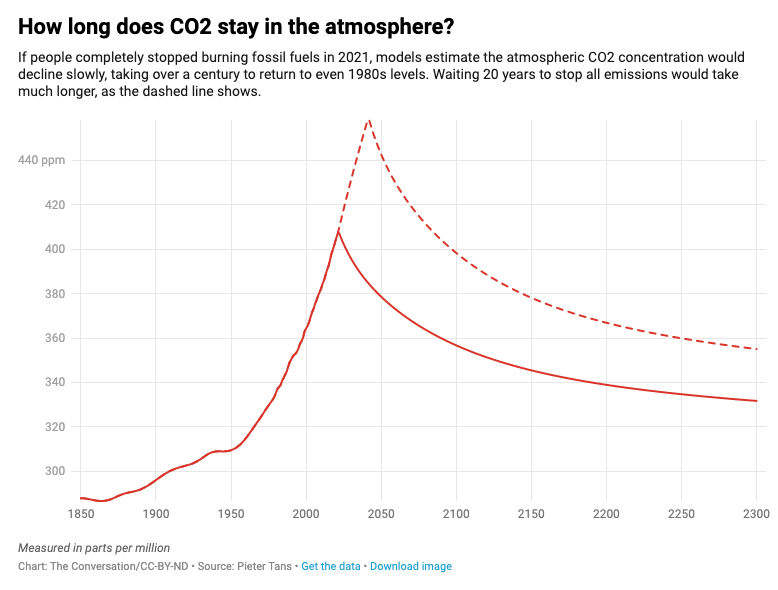
CO2 has been rising, whether you believe we produced them or not. The parts per million have gone from 287 to 406, and once in the atmosphere, they tend to hang around. Over the past few decades, it has risen by 1-3 ppm annually. And even the global lockdowns of 2020 resulted in an increase of about 2.4 ppm.
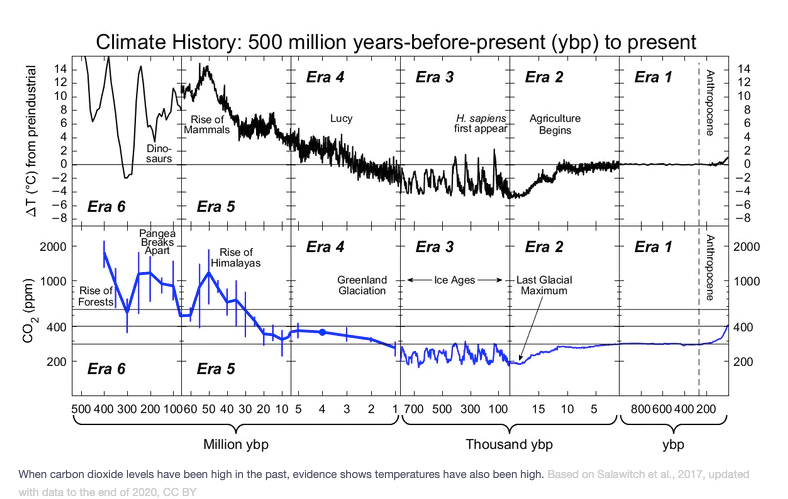
Of course, fluctuations in CO2 are not new; in fact, they steadily decreased for millennia. You can see the current rise in the Anthropocene era. The question, of course, is whether that curve continues to rise like in Era 2 or acts more like Era 3, going up and down.
 And it seems that the warming is moving much of the solid water of our planet into its liquid form as the sea level in coastal areas continues to rise.
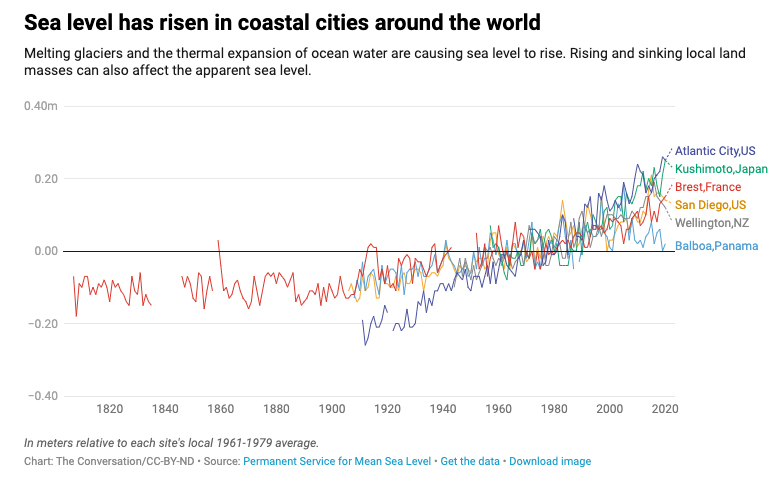
In Atlantic City, the very lowest purple line has risen about 18 inches in a century. By the way, these coastal changes are beginning to initiate migrations and mitigations, a topic that needs to be more publically addressed.
The article from The Conversation, The science everyone needs to know about climate change, in 6 charts is well worth reading. Put aside whatever beliefs you have about the source of the CO2 and look at what the science suggests is the result based not on theory but real-world observations.

Chuck Dinerstein, MD, MBA
Director of Medicine
Dr. Charles Dinerstein, M.D., MBA, FACS is Director of Medicine at the American Council on Science and Health. He has over 25 years of experience as a vascular surgeon.