
“On the back end of this Delta wave, you’re going to see prevalence be very low across the country. ….. I think we’re close to the end of this….We’re going to see a holiday spike, there’s no question about that.”
Dr. Scott Gottlieb [1]
Vaccination Trends.
Progress in attaining herd immunity has been painfully slow, with regional disparities and legal challenges, and blocks to mandates. Daily vaccination rates have bottomed out at about 0.2% of the population, suggesting that months will be required to approach immunity. Rather than eyeballing the trend plots, we developed a more rigorous method to extrapolate the vaccination trends.
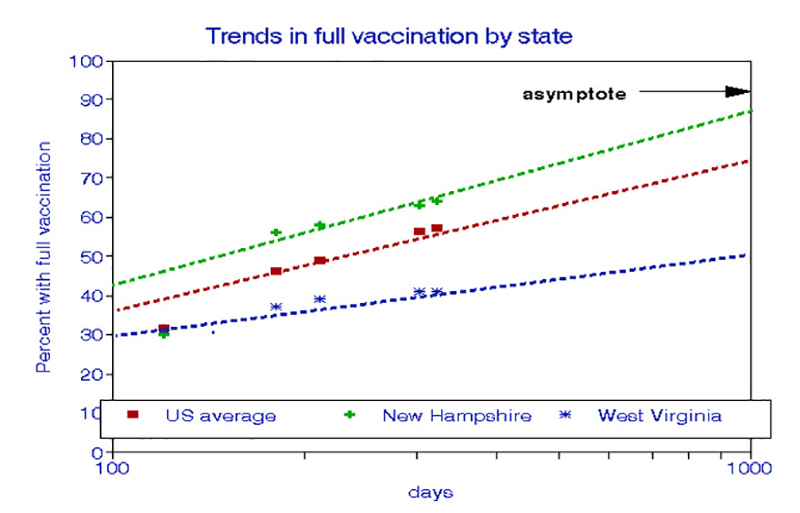
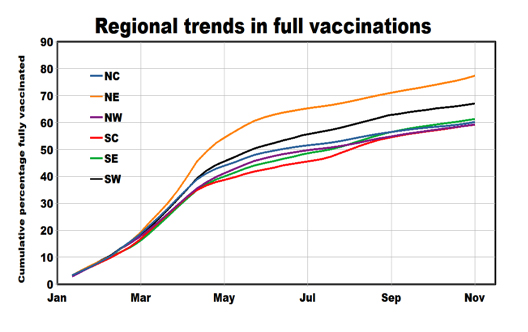 We used data from May 1 to November 12 on full vaccination (PCFV) percentages from the 48 contiguous states. The key is to account for the decrease in incremental rates over time: the later it got, the slower it rose. We used the inverse of the elapsed time (ET) - thus, time’s up when 1/ET = 0. Linear regression of PCFV on (1/ET) predict asymptotic PCFV values when 1/ET = 0.
Plots of these relationships are linear with a high degree of precision over the entire ranges of values for individual states. For the average of the 48 states, the maximum PCFV is 72.5%, with a confidence range = 71 to 74%. For New Hampshire, these estimates were 86.2%, range 78-94%. West Virginia was the worst state, with estimates of 47.5%, range 46.5-48.5%. These are extraordinarily tight confidence ranges. The graph uses 1000 days as an approach to the asymptote.
We displayed the values of these maximum (asymptotic) PCFV estimates, for the 48 states, by ranking them in order. The range is continuous, with no apparent dominant values.
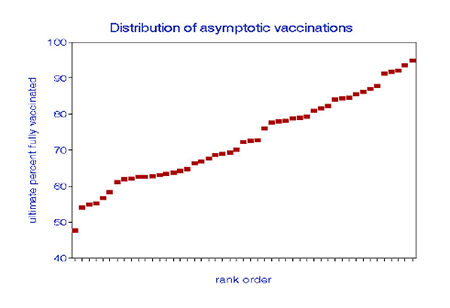 The mathematical treatment is our way of formalizing what has been shown at individual and group levels: a sizeable subpopulation is fundamentally opposed to medical intervention, come what may. These hard-core beliefs are unlikely to change in the foreseeable future. The area above the data line depicts the magnitude of this problem.
Estimates of Public Health Impacts.
We view a failure to ever achieve 100% complete vaccination as the “cost” of a state’s policies and population predilections. Such costs can be expressed in public health (additional infections and deaths) or as economics (statistical value of life). Estimates of these effects require relationships between vaccination and public health. Previously, we found that each percentage point in full vaccination rate was associated with a 4% reduction in COVID-19 case rates.
Increasing the national average full vaccination rate from the current asymptotic value of 72.5% to 100% would reduce cases from about 94,000 to about 31,000 per day and deaths from 1300 to 440 per day. For comparison, CDC recently reported 7-day averages of about 81,000 cases and 1100 deaths. [2]
Expressing these public health benefits in monetary terms requires the value of a statistical life commonly used in cost-benefit studies, which is about $7 million based on lost wages and societal effects. According to our analyses, achieving 100% complete vaccination could save about $9 billion or $18 per capita daily. For a family of 4 over a year, this could buy a very nice vacation, hopefully with none of those pesky COVID-19 travel restrictions. Such savings would be much greater in the low-vaccination states.
The nation is not “there” yet, and some of us may be unlikely ever to make it.
[1] Quoted in an interview on CBS Face the Nation, November 7, 2021, and on CBS News, November 1, 2021.
[2] Our national estimates are based on averages across states, not population-weighted.


