Media attention has focused on recent downturns in COVID-19’s breakthrough cases in hopes that the nation can reach a continuing and tolerable endemic status. Others have warned about a potential 4th wave in conjunction with increased cold weather exposures. A New York Times commentary claimed to have discovered 2-month cycles in the U.S. and globally and concludes “the worst of the pandemic is almost certainly behind us” [1].
What’s going on here? What does the future portend, given what we’ve endured thus far?
Building a model
We approached this task by examining daily COVID-19 case rates starting in January 2020 and for the next 609 days. We consider factors that we felt had strong physiologic roles in COVID-19 infections over time.
- Temporal trends (representing ongoing virus spreading)
- Seasonal variation (greater exposure in winter)
- Vaccinations (beginning January 2021)
- The arrival of the Delta variant (beginning May 2021)
We added each factor in turn to build a mathematical regression model that estimated their previous effects on daily cases that we then projected into the future.
- Temporal trends. We found a statistically significant relationship with an overall correlation of 36%. The trend over time was positive; daily cases increased in 2020 despite the increased use of face masks and social distancing.
- Adding Season. Infection rates varied by a factor of 8 between the winter and summer. Adding this factor increased the model’s correlation to 80%.
- Adding Vaccinations. We used the percentage of complete vaccinations for the entire period, including prior zeroes. The effect of vaccination was highly significant. Adding it to the model significantly reduced the seasonal impact and increased the overall correlation to 81%.
- Adding the Delta variant. We had no trend data for the Delta variant model; we assumed it began in May 2021 and increased linearly to 100% in August. The overall model correlation increased to 86%, and contributions of the other variables were reduced.
We observed considerable interaction among these parameters. In our final model
- Complete vaccination reduced daily cases by a factor of 50
- The Delta variant increased daily cases by a factor of 25
- Seasonality caused a 2-fold variation over time
Although our model fits these data very well, it’s by no means perfect. For example, our predicted daily case rate of 45,000 cases could have varied from 30,000 to 67,500 due to random variations alone.
Extrapolation
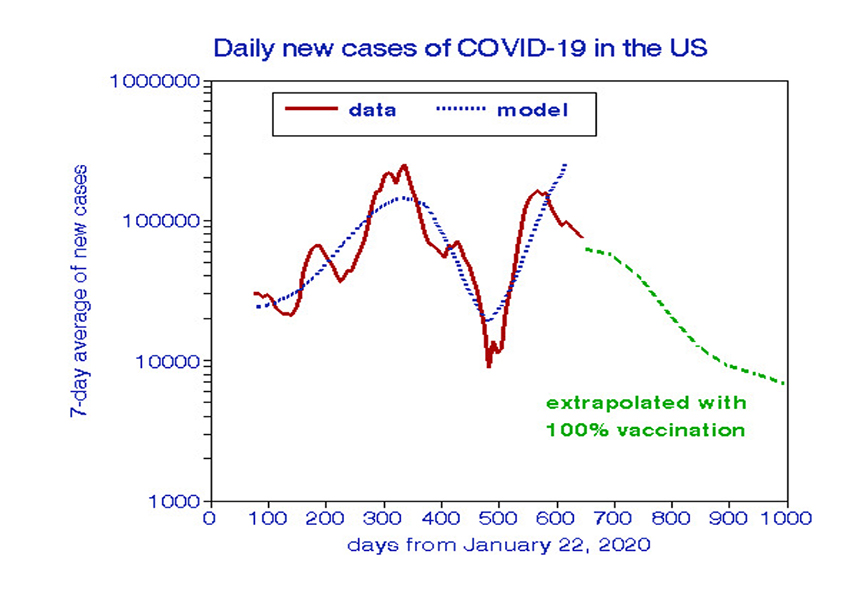
Predicting the future is a major objective of this research. In doing so, we assume that the long-term trends and seasonal cycles will continue, that complete vaccinations will reach 100%, and that new highly contagious variants will not occur. Putting this all together, the model predicts 45,000 new cases daily with an estimated daily death count of 670 during January 2022. Projecting out to the spring of 2023 yields 6800 daily new cases with 102 daily deaths. For comparison, the reported COVID-19 statistics for November 8, 2021, were a seven-day average of 72,000 new cases and 1200 new deaths. The median annualized death toll from influenza was about 80 deaths per day, with a total of 27,000 during the flu season. Vaccination appears to be the most effective countermeasure, then and now.
The graph shows how well the model fits the observed data and our estimates of the future with 100% complete vaccination.

Last thoughts
Our mathematical model is empirical and based solely on observations, but each factor we considered has a firm physiological basis. Our projections are based on continued seasonal cycles, no new variants of concern, and 100% full vaccinations – it represents a best-case scenario. If new anti-COVID medications, such as Pfizer’s Paxlovid, were proven to be effective and widely distributed, relief might occur sooner. Other COVID variants, more infectious than Delta or escaping our immune response, could arise and delay the anticipated relief. We intend to continue to model development as new data become available.
The past must be understood before the future can be predicted, as only time can tell.
[1] Covid, in Retreat NY Times
