With Thanksgiving dinner safely in the rearview mirror, we still have several more holiday feasts ahead of us. In the age of COVID-19, we also have disruptions in the supply chain – including shelves that have toilet paper, but not some holiday food items. And the rising price of turkey presages rises in the price of beef, fruits, and vegetables.

What do we actually know about the global food supply? This infographic comes from Information is Beautiful. To really appreciate the information, click on the link. You can also scroll down below this image, and I will point out a few insights.
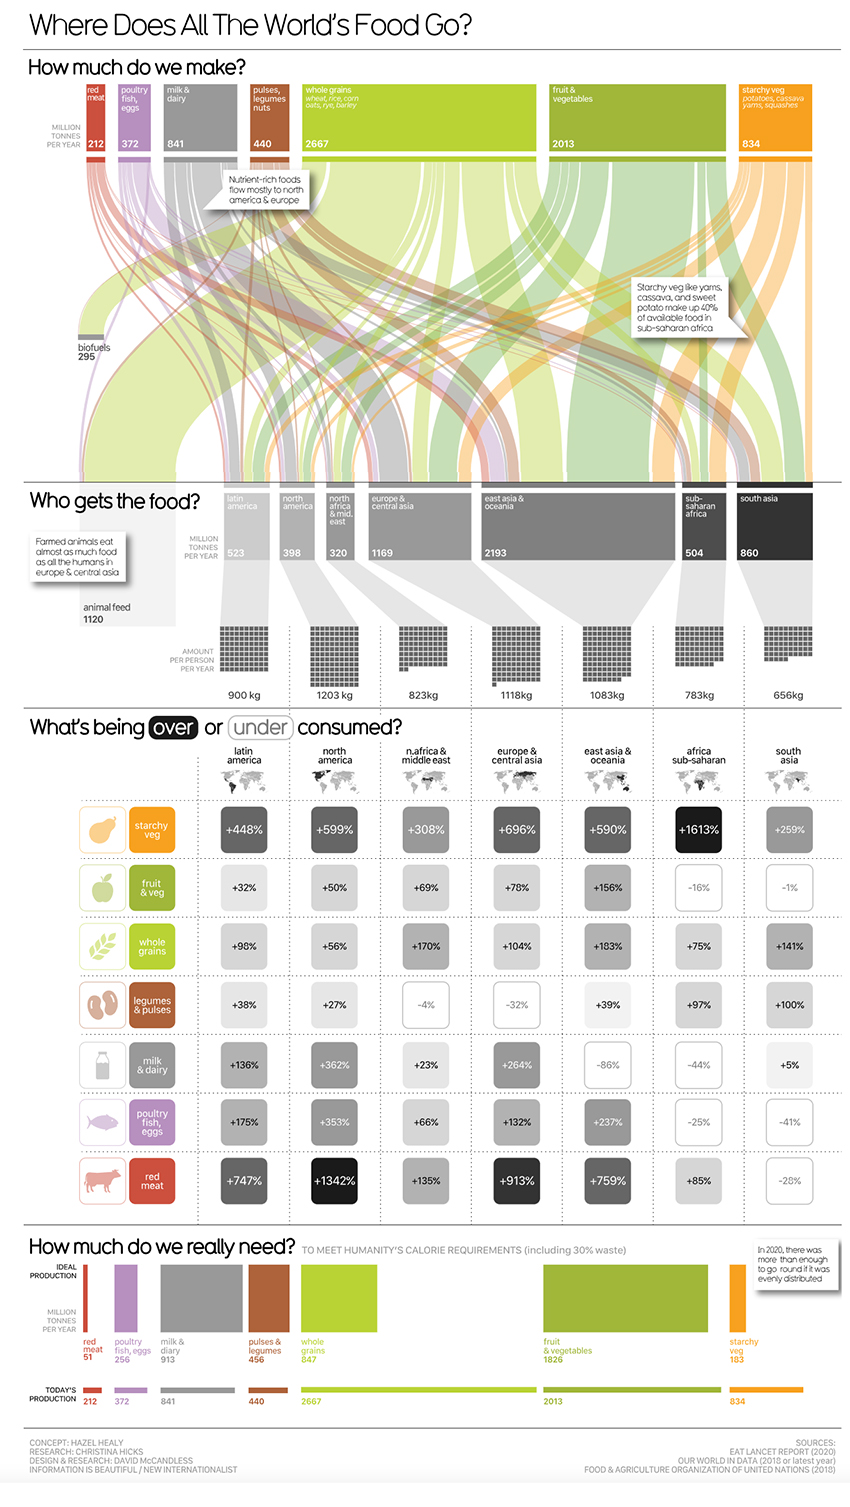
- Roughly only 10% of grains are used to create biofuels, think ethanol and jet fuel. The global consumption of red meat is still less than this amount.
- 41% of all grains are used to feed animals, which we subsequently eat. Can we consider this plant-based eating? Hardly. Is it processed food? In a sense that many of the grain proteins are converted into different “animal” proteins that we need. Of course, thermodynamics tells us that the energy contained within those feed grains is not entirely transferred to the animals, and it is further reduced when we eat the animal. Hardly efficient, but for many, tasty.
- North America consumes the most food, 1203 kg (over 1.25 tons) per person/annually – of course, 30-40% or more is food waste, and while the amount of food may fuel obesity, those numbers need to be tempered by the energy we use in being active or not.
- We have surplus food in nearly every category and continent. The significant outlier, milk and dairy in East Asia, where consumption is the lowest. But they can be forgiven; 70% or more are lactose intolerant and can't digest milk and dairy.
- Hunger is not from a lack of food but in maldistribution – a supply chain problem that has existed long before the current concerns and will, unfortunately, continue afterward.
Source of infographic Information is Beautiful They believe in data transparency; here is the underlying dataset.
Category

Chuck Dinerstein, MD, MBA
Director of Medicine
Dr. Charles Dinerstein, M.D., MBA, FACS is Director of Medicine at the American Council on Science and Health. He has over 25 years of experience as a vascular surgeon.

