
“After people recover from infection with a virus, the immune system retains a memory of it. Immune cells and proteins that circulate in the body can recognize and kill the pathogen if it’s encountered again, protecting against disease and reducing illness severity.” NIH
Acquired Immunity Vaccines cause the immune system to create proteins that fight disease, referred to as antibodies. This process is well understood in clinical settings that establish the appropriate dose and the efficacy of the vaccine (response). Epidemiological studies of affected populations are required to demonstrate effectiveness in the real world.[2] Antibodies also develop weeks after recovery from infection, acquiring immunity that will vary by person. This process is compensatory; strong infections can create more antibody defenses than weaker ones. It can be studied in individuals in a clinical setting, but since neither dose nor response (i.e., efficacy) is defined, effectiveness remains unknown in populations. Acquired immunity is thus a known but largely unquantified effect.
Methods We used monthly variations in case rates among states to provide population-based estimates. Variations in infection rates result from many factors, including dose (exposure to the virus) and response (antibody defenses), and vary significantly within a state's population. We used a statistical procedure known as linear regression to estimate these relationships. A linear relationship with a predictor variable x may be written as y = ax + b, where a is the slope and b is the intercept, the baseline value of y in the absence of x. The slope a represents the change in y per unit of x. The regression procedure finds the most likely values of a and b for a given data set, and the correlation coefficient R describes the success of that procedure. Positive values of (a) show that the x-factor adds to the baseline (b), while negative values indicate attenuation. Low correlations and slopes indicate no significant effect. Here the dependent variable y is the distribution of cases during a given month, and the (presumably) independent variable x is the distribution during a previous month.
Linear correlations of the distributions of cases from one year against those from a previous year provide a way to distinguish new developments during the current year (expressed by the intercept) from what is carried forward from the past (represented by the slope). The previous distribution of cases is the independent variable that is tasked to predict the current distribution of cases (the dependent variable) for various separations in time (lag). For short lags, most of the previous distribution is carried over, and correlations are high, approaching 1.0. By contrast, most of the distribution is new for longer lags, and correlations with the past are not statistically significant and approach zero. Correlations > 1 should be considered spurious. A negative correlation implies that the carryover reduced the cases that would have otherwise existed. This is the situation of interest here. We assume that such a reduction is due to acquired immunity and that the lag period represents the time required for such immunity to develop. We deal with a closed system during the pandemic, involving essentially the same population (minus deaths and with trivial immigration).
Data We analyzed new daily COVID-19 cases from March 2020 through November 2021 for the 48 contiguous states and the District of Columbia and divided the case counts by the state populations. We used logarithms of daily case counts to examine percentages more readily. First, we considered state-to-state variations in case counts for individual months spaced at increasing intervals. This describes how the successive sets of cases changed over time: January vs. February, January vs. March, January vs. April…etc.; then February vs. March, February vs. April, March vs. April, and so on. This procedure yielded 195 slope values used as the dependent variable in the second (national) regression analysis.
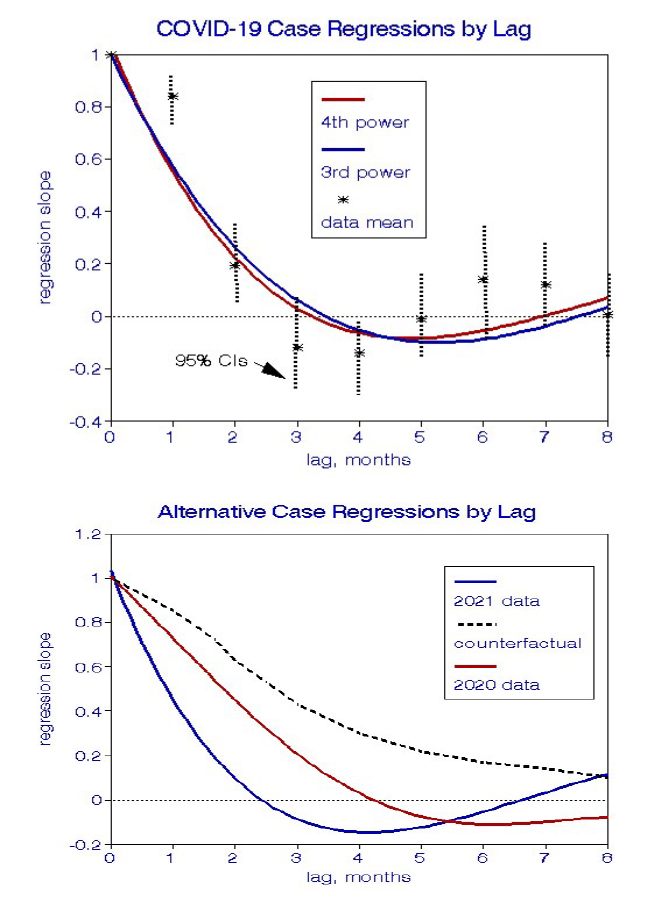
We used multivariate regressions to derive polynomial curve-fits to the 195 state-level linear regression slopes, describing how the state-to-state relationships changed during the pandemic. Essentially, we evaluated national correlations among state correlations. We tried 2nd, 3rd, and 4th-degree polynomials; 4 degrees fit the data best with a correlation coefficient of 0.74. In these analyses, the predictor variable x is lag measured in months. The graph also shows the mean regression slopes for each lag and their ranges, which are appreciable and result in part from the relatively small datasets in the state-to-state analyses (n=49).
We also fit separate curves for each year and found them to show similar suggestions of acquired immunity. For comparison, we offer a hypothetical counterfactual relationship in which the only effect of increasing lag was to add random error to those regressions, which does not comport with the data shown.
Interpretation This analysis confirmed our a priori expectations of longitudinal relationships with monthly infection rates.
- Initial lag effects were significantly positive, reflecting ongoing relationships with stationary state-level predictors such as population density, age, race, education.
- These longitudinal relationships became negative after lags of 3-6 months, ostensibly because of the beneficial effects of residual immune cells.
- At lags of 7-8 months or more, there were no significant relationships between current and initial case infection rates among states.
- The overall lag trends were similar in two independent periods, which would be unlikely if the effects were spurious.
- The correlation coefficients for the lag curve-fits were 0.7-0.8, indicting robust relationships.
- A counterfactual outcome would have comprised only positive slopes decreasing the range of lags, which our results do not support.
Risk Assessment The slope factors we derived represent the relative contributions to cases in a given month related to previous months, beginning with 100% at lag zero and ending with zero at longer lags. Following the 2021 curve, the ratio drops to about 55% at a lag of one month resulting from previous conditions, with the remaining 45% newly acquired. By lag 4, the contribution of earlier cases was about negative 10%, which we interpret as a protective effect from previous infections, i.e., acquired immunity. However, this increment comprises a minor fraction of the overall variability in daily infections. The 10% figure is a population average over millions of people, only some of whom may have shown evidence of acquired immunity.
Some Final Thoughts To our knowledge, this is the first quantitative population-based analysis of immunity acquired from COVID-19 virus infection. It is a novel observational study based on limited data and begs for replication by other means and data; uncertainties in this procedure may have contributed to the modest effects we found. Nevertheless, we show that at least some of the roller-coaster ride experienced throughout this COVID-19 pandemic may have been an intrinsic property of the virus and should thus be expected to persist. We show the existence of the acquired immunity effect but have not demonstrated its relative importance in this set of data.


